Texas multifamily construction costs range from $150-350 per square foot in 2026, with significant variations across Austin, Dallas, and Houston markets. Austin commands premium pricing at $280-350/sq ft due to land constraints and regulatory complexity, while Dallas and Houston markets offer more cost-effective development at $150-220/sq ft. Construction timelines extend 18-24 months for mid-rise projects, with permitting adding 6-12 months depending on jurisdiction. Material costs stabilized after 2022-2023 volatility, but labor shortages continue driving wage premiums of 15-25% above national averages. This comprehensive guide breaks down market-specific costs, timeline factors, and financing structures essential for Texas multifamily development success.
Texas Multifamily Construction Market Overview
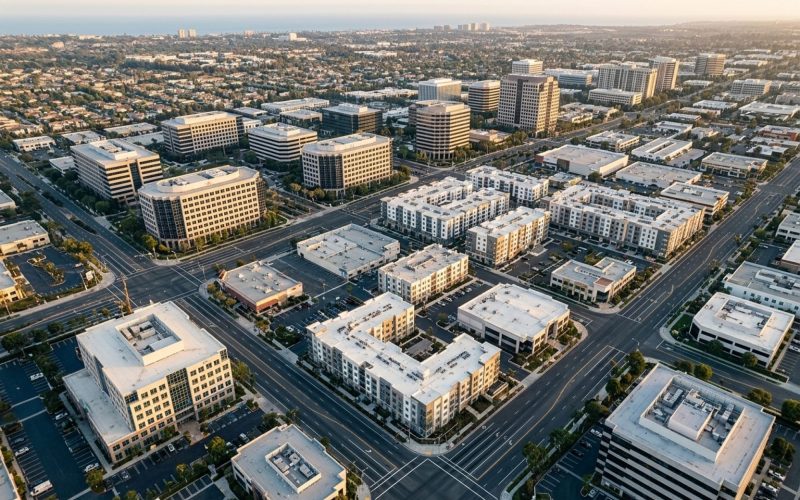
Texas leads the nation in multifamily construction activity, with over 45,000 units under construction across major metros as of Q4 2026. The state's population growth of 1.2% annually drives sustained housing demand, particularly in the Austin, Dallas-Fort Worth, and Houston markets. Construction costs have stabilized after the volatile 2022-2023 period, settling into predictable ranges that enable accurate project budgeting.
Market fundamentals support continued development activity despite elevated construction costs. Texas added 391,000 new residents in 2025, with 65% concentrated in the four major metros. Job growth in technology, energy, and healthcare sectors creates sustained rental demand for new Class A product. We've seen absorption rates of 85-95% within 12 months of lease-up across well-positioned projects.
Regulatory environments vary significantly between markets, impacting both cost and timeline. Austin's complex approval process adds 8-12 months to development schedules, while Houston's streamlined permitting enables faster project delivery. Dallas falls somewhere between, with suburban jurisdictions offering more predictable timelines than urban core developments.
Detailed Construction Cost Breakdown
Hard construction costs comprise 70-75% of total project budgets, with material and labor costs relatively stable compared to 2022-2023 volatility. Concrete prices increased 8% year-over-year but remain below peak levels. Steel pricing stabilized at $830-1,040 per ton, while lumber costs decreased 15% from 2025 highs. Labor costs continue rising due to skilled trade shortages, adding $25-35 per square foot to baseline construction budgets.
Site preparation costs vary dramatically based on topography and existing conditions. Flat Houston sites require minimal grading at $2-4 per square foot, while Austin's challenging terrain can drive site work to $15-20 per square foot. Utility connections add $8,000-15,000 per unit depending on existing infrastructure proximity and capacity requirements.
Material Cost Analysis
Concrete remains the largest material expense at $45-65 per square foot for mid-rise construction. Texas benefits from local cement production, keeping costs 10-15% below national averages. Ready-mix concrete prices stabilized at $140-160 per cubic yard across major markets. Structural steel costs add $35-50 per square foot for Type I construction, with fabrication delays extending 12-16 weeks for custom components.
Mechanical, electrical, and plumbing (MEP) systems represent 25-30% of hard costs. HVAC installation ranges $12-18 per square foot, with energy efficiency requirements driving premium equipment selection. Electrical rough-in costs $8-12 per square foot, while plumbing systems add $15-22 per square foot including fixture installation. Fire suppression systems add $4-6 per square foot for buildings exceeding three stories.
Labor Market Dynamics
Skilled labor shortages continue impacting project timelines and costs across Texas markets. Hourly wages for experienced trades increased 12-18% in 2025, with concrete finishers commanding $28-35 per hour and electricians earning $32-42 per hour. General contractors report 15-20% of positions remain unfilled, particularly in specialized trades like elevator installation and building automation systems.
Subcontractor availability varies by market, with Houston offering the deepest labor pool and Austin experiencing the tightest supply. We've seen projects delayed 4-8 weeks due to subcontractor scheduling conflicts, particularly during peak construction season from March through October. Smart developers now lock subcontractor commitments 6-9 months ahead of need dates.
Market-Specific Cost Analysis
Dallas-Fort Worth delivers 25-40% lower construction costs than Austin, with Houston falling in between - market selection drives project economics more than any other factor
Austin Market Premiums
Austin construction costs reflect the market's unique challenges and regulatory environment. Land costs of $8-15 per square foot of developable area represent 20-25% of total project budgets. Permitting complexity adds 8-12 months to development timelines and $15-25 per square foot in carrying costs. The city's enhanced design standards require upgraded materials and finishes that add 10-15% to baseline construction budgets.
Environmental compliance costs are particularly significant in Austin, with creek setbacks, tree preservation, and stormwater management adding $12-25 per square foot. Historic district requirements in central locations can drive costs above $400 per square foot when facade preservation and design compatibility measures are required.
Dallas-Fort Worth Efficiency
Dallas-Fort Worth offers the most cost-effective large-market development environment in Texas. Suburban jurisdictions like Plano, Richardson, and Arlington provide streamlined permitting and lower impact fees. Construction costs of $150-200 per square foot enable competitive rent structures while maintaining healthy development margins.
The market benefits from established subcontractor networks and competitive bidding environments. Material delivery costs are minimized by central distribution networks serving the sprawling metro area. Parking requirements of 1.5-2.0 spaces per unit add $15,000-22,000 per unit but surface parking options keep these costs manageable in suburban locations.
Houston Market Advantages
Houston's minimal zoning and streamlined development process create favorable construction economics. Permitting timelines of 4-6 months are among the fastest for major metros. Flat topography minimizes site preparation costs, while abundant industrial infrastructure supports efficient material delivery and equipment access.
Energy corridor and medical center developments command premium rents that support construction costs up to $220 per square foot. However, flood plain regulations following Hurricane Harvey add complexity and cost to certain locations. Elevated construction requirements can add $25-40 per square foot in FEMA flood zones.
Construction Timeline and Critical Path
Austin's 15-month permitting process triples Houston's timeline, adding $15-25/SF in carrying costs that compound the market's construction premium
Texas multifamily development timelines span 24-36 months from land acquisition to certificate of occupancy. Permitting represents the most variable component, ranging from 4 months in Houston to 15 months in central Austin. Construction duration remains relatively consistent at 18-24 months for mid-rise projects, with high-rise developments extending to 30-36 months.
Pre-construction phases consume 6-12 months and include site analysis, architectural design, engineering, and permit submission. Texas markets require extensive utility coordination, particularly for electricity connection in ERCOT territories. We typically allow 3-4 months for utility design and approval processes, with longer timelines in high-growth suburbs where infrastructure capacity is constrained.
Critical Path Management
Successful Texas developments require careful sequencing of critical path items to avoid delays. Foundation work must coordinate with utility rough-ins to prevent costly rework. MEP rough-in timing affects drywall and flooring installation schedules, with delays cascading through final phases. Elevator installation represents a common bottleneck, with 16-20 week lead times requiring early commitment and precise scheduling.
Weather impacts are generally minimal compared to northern markets, but summer heat affects concrete pours and exterior work productivity. Most contractors adjust schedules for 6 AM starts during July and August heat waves. Hurricane season preparedness in Houston adds 2-3 weeks annually for equipment securing and site preparation, though actual storm delays are infrequent.
Development Financing Strategies
Texas multifamily development financing has evolved significantly since 2022 interest rate increases. Construction loan rates range 8.5-11.5% depending on borrower strength and project risk profile. Most lenders require 25-30% developer equity, with experienced developers occasionally securing 20% down structures. Loan-to-cost ratios typically cap at 75-80% for stabilized developers with strong track records.
Construction-to-permanent financing remains popular for build-to-hold developers, though fewer lenders offer these products compared to pre-2022 markets. Interest rate locks during construction add 0.25-0.75% to permanent rates but provide certainty for pro forma modeling. Most permanent takeouts require 85-90% occupancy and 12 months of operational history before conversion.
Capital Stack Optimization
Optimal capital structures blend construction debt with strategic equity partners to minimize overall cost of capital. Regional banks remain the primary construction lenders, with loan amounts typically ranging $15-75 million per project. Credit unions serve the smaller development market under $20 million, often offering more flexible terms for local developers.
Preferred equity has gained popularity as a middle-tier financing option, typically priced at 12-16% returns with profit sharing above developer hurdles. This structure reduces required common equity while maintaining developer control. Joint venture structures with institutional capital sources provide access to larger projects but require giving up 50-70% of profits above preferred returns.
Cost Control and Value Engineering
Effective cost control begins during the design phase with value engineering focused on constructability and material efficiency. Standard unit layouts reduce framing complexity and MEP routing costs by 8-12% compared to highly customized designs. Repetitive floor plates enable subcontractor efficiency gains and reduce change order frequency during construction.
Material selection significantly impacts both initial costs and long-term maintenance expenses. Fiber cement siding adds $3-5 per square foot versus vinyl but reduces maintenance costs over 20-year holding periods. Energy-efficient windows and HVAC systems command higher installation costs but generate ongoing operational savings that support premium rents and higher exit valuations.
Procurement Strategies
Strategic material procurement can reduce costs 5-10% through bulk purchasing and early commitment contracts. Concrete and steel represent the largest opportunities for negotiated pricing, particularly for developers with multiple projects. Elevator and specialty equipment require 4-6 month lead times, making early procurement essential for timeline management.
Local material sourcing provides cost advantages while supporting faster delivery schedules. Texas aggregate and concrete producers offer competitive pricing compared to national suppliers. Regional millwork and cabinetry fabricators provide customization options at competitive pricing while reducing transportation costs and delivery risks.
Permitting and Regulatory Compliance
Texas permitting requirements vary dramatically between jurisdictions, creating opportunities for strategic site selection based on regulatory efficiency. Austin's development process involves multiple departments and extensive public input periods that extend timelines significantly. Affordable housing components can accelerate Austin approvals through density bonus programs and expedited review tracks.
State-level regulations focus primarily on accessibility compliance, energy codes, and structural standards. Texas Accessibility Standards (TAS) exceed federal ADA requirements and affect unit layout and common area design. Energy conservation codes require enhanced insulation and HVAC efficiency that add $8-12 per square foot to construction costs but reduce ongoing operational expenses.
Municipal Variations
Houston's lack of traditional zoning creates unique opportunities and challenges for multifamily developers. Deed restrictions and municipal utility districts provide some land use controls, but developers have significant flexibility in project design and density. This regulatory environment enables faster approvals but requires more extensive due diligence regarding deed restrictions and neighborhood compatibility.
Dallas and Fort Worth maintain traditional zoning frameworks with clear multifamily development standards. Planned development districts offer density bonuses and design flexibility in exchange for enhanced amenities and infrastructure improvements. Impact fees range $2,000-8,000 per unit depending on jurisdiction and required infrastructure improvements.
Risk Management and Contingency Planning
Texas development projects face multiple risk categories requiring careful management and appropriate contingency planning. Construction cost contingencies of 5-8% are typical, with higher percentages for complex sites or challenging market conditions. Weather delays are generally minimal, but hurricane season preparations in coastal markets add scheduling complexity and potential cost impacts.
Material price volatility continues affecting project budgets despite recent stabilization. Forward contracts for major materials like concrete and steel provide price certainty but require capital commitments 6-9 months ahead of delivery. Alternative material specifications offer flexibility when primary choices face supply chain disruptions or unexpected price increases.
Subcontractor default represents an increasing risk in tight labor markets. Thorough financial vetting and performance bonding for trades exceeding $500,000 provides protection against mid-project failures. Backup subcontractor relationships enable rapid replacement when performance issues arise, though replacement costs typically exceed original contracts by 10-20%.
Market Risk Considerations
Absorption risk varies significantly between Texas submarkets, with urban core locations typically achieving faster lease-up than suburban developments. Pre-leasing programs beginning 90-120 days before completion help identify market reception and adjust rental pricing strategies. Concession strategies should be planned during development to avoid margin pressure during initial lease-up periods.
Interest rate risk affects both construction financing costs and permanent takeout economics. Rate locks and caps provide protection but add costs that must be factored into development budgets. Forward-looking analysis of permanent financing markets helps developers prepare for various rate scenarios during the 24-36 month development cycle.
Texas Multifamily Development Outlook
Texas multifamily construction activity is expected to remain robust through 2026-2027, supported by continued population growth and job creation. Technology sector expansion in Austin and energy sector growth in Houston drive demand for high-quality rental housing. Cost pressures are likely to persist due to labor shortages and regulatory complexity, but stabilized material costs provide some budget predictability.
Regulatory trends point toward increased complexity and cost, particularly in Austin and Dallas markets. Environmental compliance requirements continue expanding, while affordable housing mandates affect development economics in certain jurisdictions. Successful developers are building compliance costs into pro formas and adjusting target submarkets based on regulatory efficiency.
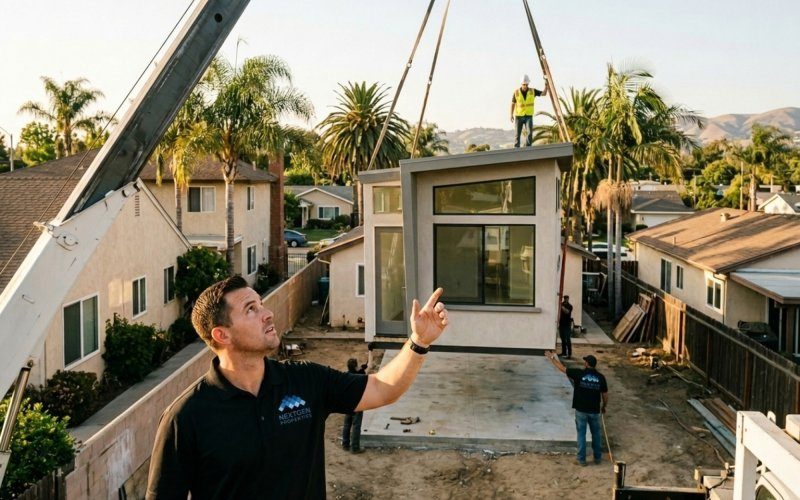
Supply chain resilience has improved significantly since 2022-2023 disruptions, but developers continue maintaining diversified supplier relationships and flexible material specifications. Construction technology adoption accelerates efficiency gains that partially offset labor cost increases. We expect continued evolution toward standardized designs and prefabricated components that reduce field labor requirements and improve quality control.
Frequently Asked Questions