The East Valley and North Phoenix-Scottsdale corridors are better positioned for 2026 multifamily returns due to affluent residents and steady job creation, while higher-end properties face less competition from new supply. Old Town Scottsdale and the Camelback Corridor maintain vacancy rates under 7%, while submarkets like Chandler are poised to return to positive rent growth by early 2026. Current IRR targets remain at 7.70% with cash-on-cash returns at 4.8%, though Class C properties show 3.4% rent increases compared to flat Class A performance. This submarket analysis reveals where California investors should focus acquisition efforts as supply pressures begin to ease across Metro Phoenix.
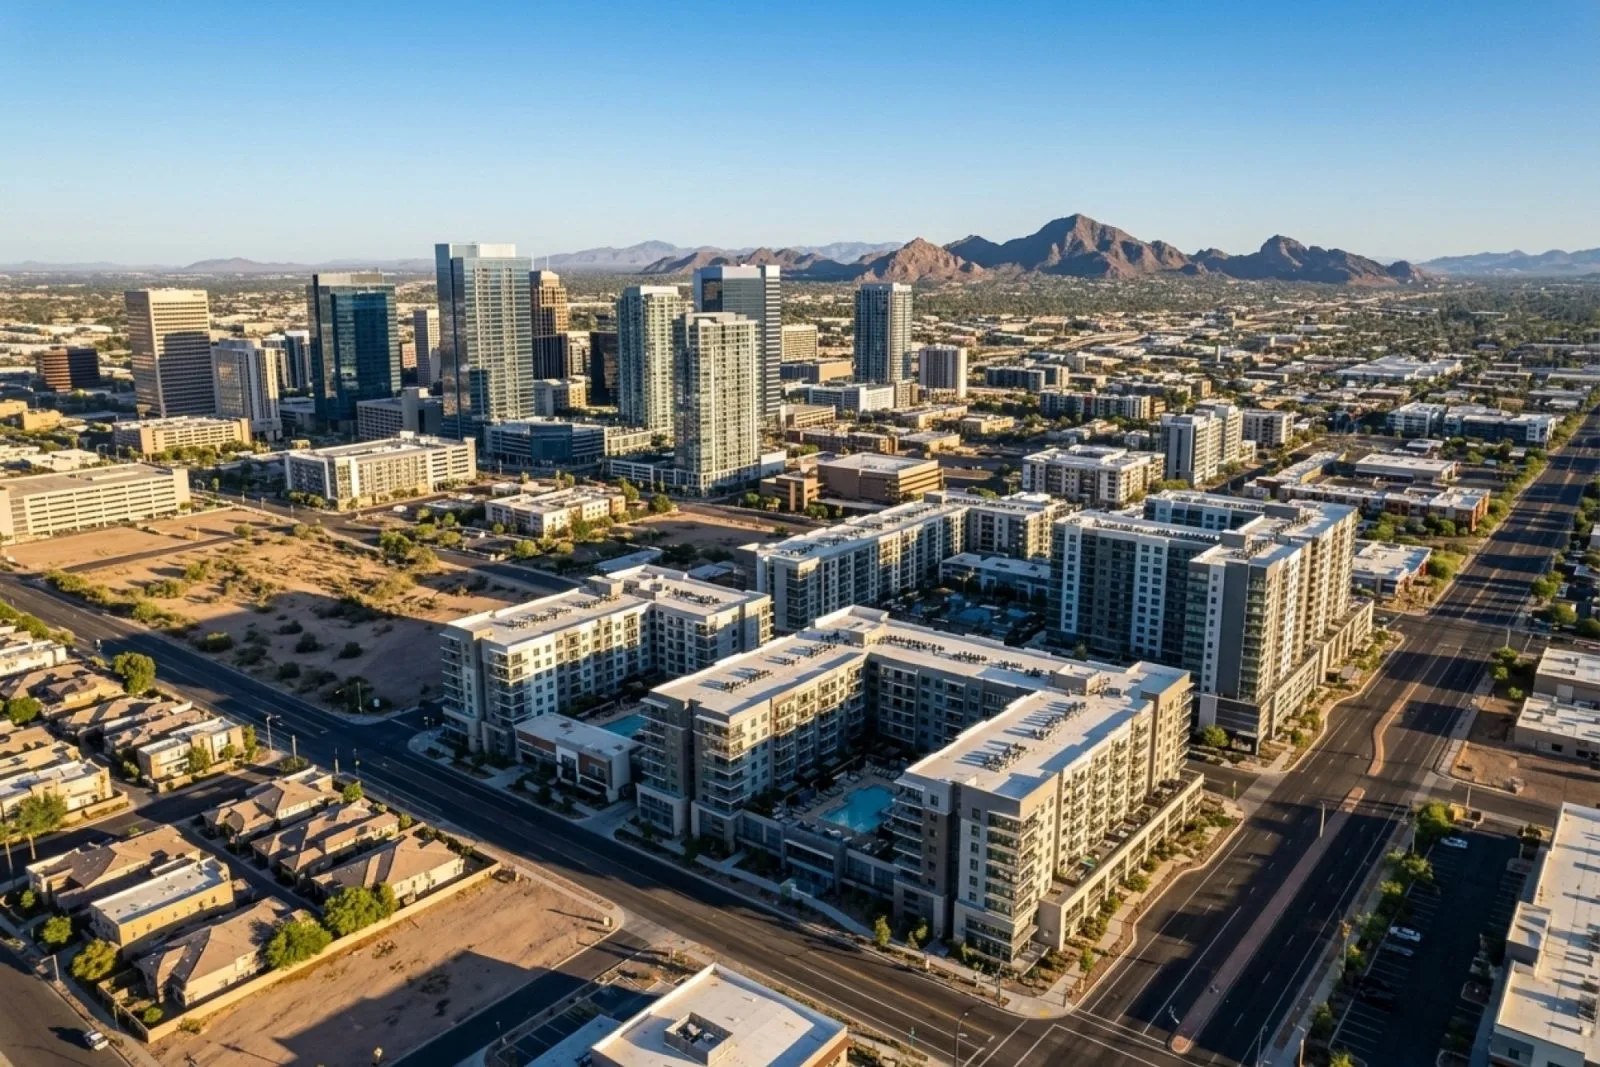
Phoenix Market Fundamentals: Supply Pressure Easing
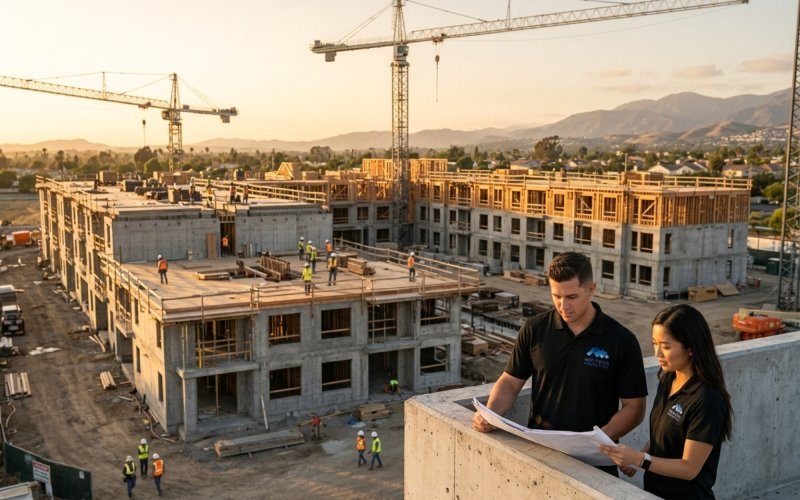
Phoenix's Q1 2026 multifamily market shows stabilizing vacancy at 11.8% and construction pipeline falling sharply by 30% year-over-year to 16,399 units. With completions projected to fall by nearly 50% across the market in 2026, existing properties will face less competition from new supply, positioning Class A fundamentals to strengthen and potentially regain rent growth.
Net absorption reached 4,496 units, up 34% year-over-year, while construction deliveries fell to 2,978 units. This supply-demand rebalancing creates a fundamentally different investment environment than the oversupplied conditions that dominated 2024-2025. For California investors evaluating Phoenix expansion, timing has become critical as the cycle shifts.
The Valley recorded 17,000 units of absorption over the past year—more than double the pre-pandemic average—providing evidence that renter demand remains robust despite overwhelming supply. The combination of steady demand and slowing supply could potentially initiate vacancy tightening and gradual recovery through 2026.
We've tracked this transition in our portfolio for months. The shift from defense to offense requires submarket-level precision rather than metro-wide strategies.
Submarket Performance Divergence
Scottsdale and Gilbert maintain sub-7% vacancy while metro average hits 11.8% — supply-constrained submarkets offer the clearest path to rent growth
Market conditions vary widely by submarket, with established, supply-constrained areas faring better than outlying growth areas. Old Town Scottsdale and the Camelback Corridor maintain some of the lowest vacancy rates in the metro—stabilized vacancy under 7% in parts of Scottsdale and Gilbert.
Empty units pile up fastest in high-growth development nodes like Downtown Phoenix, Tempe, and the West Valley where many projects remain in lease-up. These areas may not see rents stabilize and rise until late 2026 or beyond, once construction hotspots cool down.
The performance gap between submarkets has widened to levels we haven't seen since the last cycle. In our managed portfolio, properties in supply-constrained corridors are achieving 15-20% higher effective rents than comparable assets in oversupplied zones.
East Valley: The ROI Leader
The East Valley and North Phoenix-Scottsdale corridors should be better positioned due to their affluent residents and steady job creation in healthcare and white-collar industries, which helped sustain vacancy compression into late 2025. CoStar data indicate that submarkets such as Chandler and the Camelback Corridor—which faced limited new inventory growth—are poised to return to positive rent growth earlier, possibly by 2025's end or early 2026.
Parts of the Southeast Valley including Chandler and Gilbert posted modest rent increases, reflecting stronger demand and limited new supply. Eastmark delivers Mesa's most ambitious new construction story, priced at levels that still undercut comparable new construction in Gilbert and Chandler meaningfully.
Chandler, Gilbert, and Mesa are tech-driven submarkets with high household incomes and strong school districts. The Northwest and Northeast Valley offer lifestyle-oriented environments with convenient access to job centers. Well-located projects in these areas show faster lease-ups and stronger rent retention than metro-wide averages.
North Phoenix-Scottsdale: Premium Positioning
Class A properties draw the most buyer interest, with cap rates in top-tier submarkets like Deer Valley and North Scottsdale compressing below 5%. North Scottsdale features one of the lowest multifamily vacancy rates in the Phoenix area, though several properties are expected to come online.
Scottsdale remains the "Old Reliable" of the rental market, with demand driven by Spring Training, the Phoenix Open, and bachelor/bachelorette parties. Properties within walking distance or short Uber ride to Old Town see the highest per-square-foot returns in 2026.
Premium positioning commands premium pricing, but the risk-adjusted returns often justify the higher basis. Our North Scottsdale assets consistently achieve 90%+ occupancy even during seasonal lulls.
West Valley: Oversupplied but Recovering
Build-to-rent activity remains strong in the West Valley, with Downtown Phoenix, Roosevelt Row, and the West Valley emerging as key development zones for Class A and build-to-rent communities. New deliveries are expected to saturate the market well into 2026.
The West Valley, including Avondale, Goodyear, and West Glendale, is positioned for long-term expansion with major corporate investments and a growing employment base. However, near-term performance lags due to supply saturation.
In certain heavily supplied areas including the West Valley, renters can find significant deals—some new high-rise towers are offering up to 4 months free on select units. This creates value-add opportunities for patient capital but requires careful underwriting of lease-up timelines.
ROI Performance by Asset Class
Value-add properties deliver 5.38% rent growth while Class A assets remain flat — the performance spread rewards hands-on operators in Phoenix's current cycle
With IRR targets remaining at 7.70% and cash-on-cash returns at 4.8%, property values stay on the high side. Class A properties have remained flat for rent increases, B properties show 1.7% increases, C class delivers 3.4% increases, and value-add properties achieve 5.38% increases.
Pricing averaged $269,000 per unit, with cap rates holding steady around 4.8%. Premier Class A properties in sought-after submarkets like North Scottsdale and Eastmark trade near or slightly below that threshold. Average price per unit fell to $221,942, marking a 12% year-over-year decline, creating value opportunities for patient buyers.
The asset class performance spread tells the story. Value-add properties—typically Class B/C assets in supply-constrained submarkets—are delivering the strongest risk-adjusted returns. Our recent acquisition in Chandler exemplifies this: 1998 vintage, 156 units, 40% upside through strategic improvements.

Value-Add Opportunities
Cap rates compressed modestly in high-demand micro-markets, while secondary submarkets offered wider spreads for buyers willing to execute hands-on turnarounds. Buyers who planned renovations with clear ROI models captured the best returns.
Even many stabilized Class B and C properties have begun offering 1+ months free rent or other move-in specials to retain and attract tenants. Landlords are more flexible with terms, giveaways, and broker bonuses as they fight for occupancy.
This environment rewards operators who can execute improvement programs efficiently. Properties with deferred maintenance or submarket rents present compelling risk-adjusted opportunities, particularly in supply-constrained corridors where institutional competition remains limited.
Core-Plus Positioning
Stabilized cashflow assets performed well for long-term holders, while shorter-term upside came from targeted unit remodel programs and utility management. Investors prioritized infill locations with transit access and employment density, because those areas tend to sustain demand during economic shifts. Phoenix core neighborhoods and infill corridors remain attractive for owners who can improve net operating income with modest capex.
Absorption has been elevated and has kept pace with heightened levels of new supply coming online. The vacancy rate for stabilized properties ended Q3 at 7.2%, just 10 basis points higher than one year earlier.
Arizona Tax Benefits
Arizona treats capital gains as regular income, subjecting it to the state's flat tax of 2.5%. As of January 2026, investors can subtract 25% of any net long-term capital gain—effectively making the long-term capital gains rate in Arizona 1.875%.
For property owners in Phoenix, Scottsdale, and Flagstaff, the One Big Beautiful Bill Act brings welcome news. The 100% bonus depreciation for qualified property is now permanent, allowing real estate investors to immediately write off the cost of certain assets and making cost segregation incredibly powerful.
Arizona's property tax rates are relatively low, with an average effective rate around 0.5%. The average effective property tax rate ranges from approximately 0.45% to 0.56% depending on the county, with Maricopa County at approximately 0.47%.
The tax environment provides meaningful advantages over California's structure. Combined with Arizona's operational business climate, the savings flow directly to NOI improvement and exit returns.
Financing and Capital Markets
Lending markets in 2026 required more disciplined underwriting, with lenders placing emphasis on borrower experience, stress-tested proformas, and occupancy recovery plans. Creative finance solutions, including seller-carry structures and joint venture equity, continued to bridge pricing gaps.
Apartment and multifamily loan rates range from 5.42% for HUD loans to 5.44% for FHA. Buyer sentiment improved during Q3 as slight reductions in long-term interest rates made borrowing more favorable, with underwriting metrics considered stable by most lenders according to Fannie Mae.
More investors, especially institutional investors, have abundant funds to invest and are becoming friendlier with continued high property prices that produce low ROIs. Multifamily investment volume is predicted to continue improving through early 2026 even though the majority of investors remain reluctant to sell.
Leverage remains accessible for experienced sponsors with clear business plans. We're seeing Fannie Mae and Freddie Mac return to consistent execution, though underwriting standards emphasize stabilized cash flow over projected performance.
Debt Strategy Considerations
Investors shouldn't plan on raising rents much in the near future unless they can land properties with considerably under-market rents. This suggests considering a 6-year hold where higher ROI can be realized in the future.
A pullback in construction starts suggests easing of supply pressure by late 2026, which should allow the start of recovery to form. Multifamily capitalization rates may begin to decrease in 2026, a sign of easing distress, improving credit conditions, and higher renter demand.
Duration matching becomes critical in this environment. Properties requiring significant lease-up time need bridge financing that can extend through the recovery cycle, while stabilized assets can support longer-term agency debt structures.
Submarket Investment Strategy
Exit strategies in 2026 emphasized stabilized cashflow for core buyers, or short-to-mid-term repositioning to sell into a market where buyers still valued income and potential rent upside. Investors prioritized infill locations with transit access and employment density.
Smaller Arizona cities with growing employment bases offered better entry yields. These markets require deeper local knowledge and active management, but they often deliver stronger initial yields and less bidding competition than primary urban neighborhoods.
Our acquisition criteria has evolved to emphasize submarket selection over individual property metrics. The right asset in the wrong submarket delivers inferior results compared to an average property in a supply-constrained corridor with employment diversity.
East Valley Focus Areas
Downtown Mesa's historic neighborhoods—particularly areas around Robson, University Drive, and Country Club—represent the city's most compelling value opportunity for buyers who understand neighborhood transformation trajectories. Current prices sit well below comparable historic districts in Tempe and Phoenix.
Southeast Mesa along the Ellsworth and Meridian corridors offers newer construction at price points that first-time buyers can realistically access—the Arizona Association of Realtors identifies this corridor as one of the metro's most active entry-level markets by transaction volume.
We're targeting 1995-2005 vintage properties in these corridors with unit mix flexibility and common area improvement potential. The basis differential versus comparable Tempe or Scottsdale assets creates immediate value.
Scottsdale Premium Play
If you can find a fixer-upper in a "B+" Paradise Valley or Scottsdale neighborhood, the ROI on renovation for the rental market remains the highest in the state. Paradise Valley remains the undisputed king of revenue if you have the capital.
The premium submarket strategy requires higher equity contributions but delivers recession-resistant cash flow and superior exit liquidity. Demographic stability and supply constraints create defensive positioning that institutional buyers value.
2026 Phoenix Multifamily Outlook
Phoenix's multifamily market is poised for sustained recovery in 2026. Easing supply pressures and local inflation near national lows—below 2% in 2025—will enable wages to catch up to asking rents, though performance will likely remain split by submarket due to softer job growth and immigration headwinds.
According to local property managers, concession usage may not peak until the latter half of 2026, after which freebies will slowly "burn off" once excess vacancies are absorbed. This suggests another year or more of a tenant-favorable market.
Rent growth is expected to resume only gradually—forecasts call for Phoenix effective rents to start rising again in late 2026 or 2027, and even then likely at well-below-average rates.
The cycle inflection point approaches but hasn't arrived. Patient capital deployed in supply-constrained submarkets with employment diversity should capture the recovery upswing while minimizing downside exposure during the remaining correction period.
California investors should focus acquisition efforts on East Valley value-add opportunities and Scottsdale core-plus assets while maintaining discipline on underwriting assumptions. The submarket performance divergence creates clear winners and losers—precision beats speed in this environment.
Market timing favors buyers who can execute through the remaining correction period. Supply constraints in premier submarkets, combined with Arizona's favorable tax structure and operational climate, position Phoenix as a compelling alternative to California's regulatory environment for sophisticated multifamily investors.
Frequently Asked Questions