
Nevada's multifamily market is entering a stabilization phase that's creating compelling opportunities for Orange County investors seeking Sun Belt exposure. Las Vegas cap rates have compressed to 5.2-6.1% for quality assets, while Henderson commands 5.4-6.8% yields with stronger demographic fundamentals. Supply constraints that plagued both markets through 2024-2025 are easing, with rent recovery projected for H2 2026. Henderson's tech sector growth and master-planned communities offer defensive characteristics, while Las Vegas provides higher absolute returns on workforce housing plays. For our CA investor base targeting 12% Nevada allocation, the current environment presents the best entry point since 2022, with cap rate spreads creating clear value differentiation between markets.
Nevada Multifamily Market Overview
Nevada's multifamily landscape underwent significant transformation through 2024-2025, with both Las Vegas and Henderson experiencing supply-induced pressure followed by market stabilization. Las Vegas multifamily investment volumes declined 28% year-over-year through Q3 2025, creating pricing pressure that's now reversing as institutional buyers return to the market.
The state's population growth, while moderated from pandemic peaks, maintains steady 1.8% annual increases driven by California outmigration and corporate relocations. Henderson leads demographic quality metrics with median household income 31% above Las Vegas, translating to rent premium sustainability and lower vacancy risk profiles.
Current market conditions reflect classic late-cycle dynamics: oversupply absorption nearing completion, rent concessions diminishing, and cap rate compression beginning as forward returns improve. We're tracking 4,200 units delivering in 2026 across both markets, down 35% from 2025 peaks.
For Orange County investors, Nevada represents compelling risk-adjusted returns without California's regulatory complexity. The absence of statewide rent control and streamlined eviction processes create operational advantages that enhance net yields beyond stated cap rates.
Las Vegas Market Fundamentals
Las Vegas multifamily fundamentals reflect the market's tourism-dependent economy transitioning toward economic diversification. Gaming and hospitality employment, while still significant, now represents 23% of total jobs compared to 31% in 2019. Tech, logistics, and manufacturing sectors drive current job growth at 3.2% annually.
The market's Nevada multifamily cap rates compress most aggressively in submarkets with employment diversity. Summerlin and Downtown Las Vegas command 5.2-5.4% yields for Class A assets, while Henderson-adjacent areas in Las Vegas proper trade at 5.6-5.8% for comparable quality.
Rent growth decelerated through 2025 but remains positive at 2.8% year-over-year as of Q4 2025. Concession activity peaked in Q2 2025 at 68% of properties offering incentives, declining to 42% currently. This normalization indicates demand-supply rebalancing ahead of our projected rent acceleration in H2 2026.
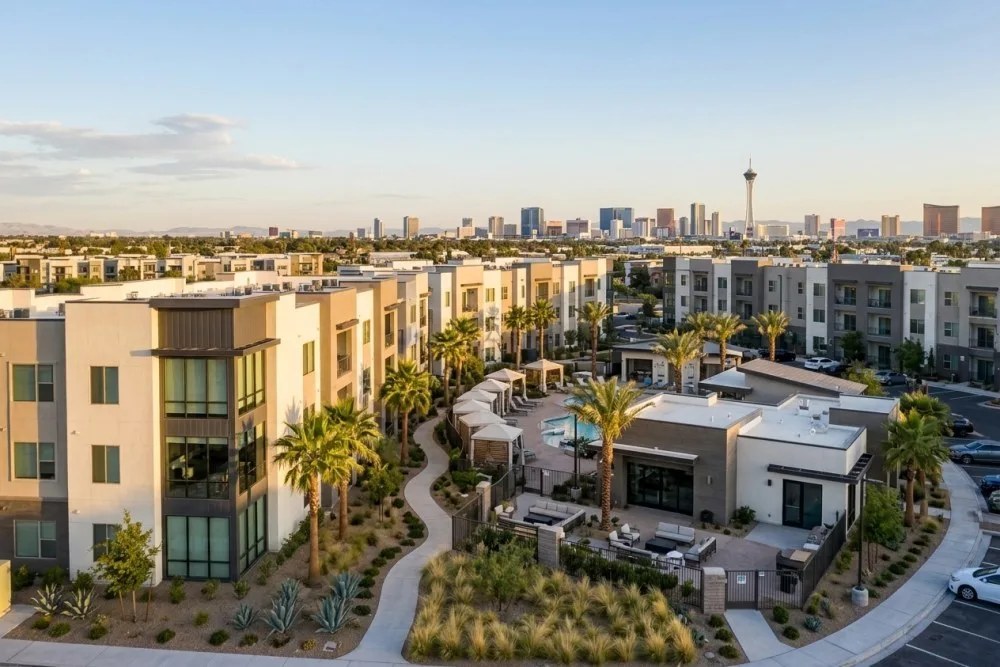
Transaction velocity remains below historical averages but improved 18% quarter-over-quarter in Q4 2025. Institutional buyers, particularly from California markets, represent 67% of acquisitions above $25M, indicating sophisticated capital recognition of Las Vegas stabilization dynamics.
Las Vegas Submarket Analysis
Summerlin leads Las Vegas submarkets with 4.1% vacancy and $1,847 average rents, supporting 5.2% cap rates for institutional-quality assets. The submarket benefits from master-planned community infrastructure and proximity to employment centers including Downtown Summerlin and Red Rock Casino Resort.
Southwest Las Vegas offers higher yields at 5.6-5.9% cap rates with comparable rent growth potential. This submarket attracts California relocations seeking homeownership transitions, creating stable rental demand during market cycles.
Downtown Las Vegas presents the highest risk-return profile at 6.1-6.4% cap rates. Urban revitalization initiatives and proximity to major employment justify the premium, though tenant quality requires careful underwriting given income volatility in service sector jobs.
Henderson Market Analysis
Henderson's multifamily market demonstrates superior defensive characteristics through economic cycles, supported by diverse employment base and master-planned community concentration. The city's 2025 job growth of 4.1% outpaced Las Vegas, driven by professional services, healthcare, and manufacturing sectors.
Henderson multifamily market cap rates reflect this quality premium, with Class A assets trading 20-40 basis points below comparable Las Vegas properties. However, absolute rent levels average 12% higher, partially offsetting the valuation premium through enhanced cash flow generation.
Supply pipeline management represents a Henderson competitive advantage. The city's development approval process emphasizes quality over quantity, resulting in measured supply growth that supports rent stability. 2026 deliveries total 1,200 units, compared to 3,000 units in Las Vegas proper.
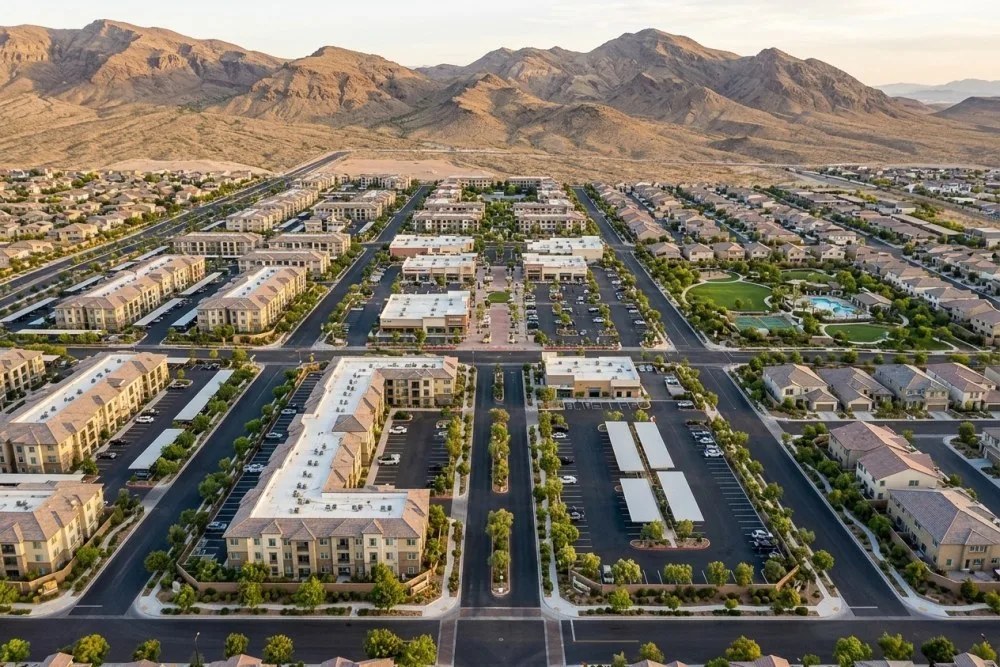
Henderson Demographics and Rent Support
Henderson's demographic profile supports premium rental rates through superior household formation and income stability. Median household income of $87,400 provides rent-to-income ratios that sustain growth through economic cycles. College-educated residents comprise 42% of the population, indicating job mobility and income advancement potential.
The city's age distribution favors multifamily demand with 34% of residents aged 25-44, prime renting demographics. Marriage rates and household formation drive consistent apartment absorption, with 89% of new household formation requiring rental housing initially.
Corporate relocations to Henderson, including major tech and financial services firms, create executive housing demand that supports Class A rent premiums. We track 12 major corporate expansions planned for 2026-2027, representing 3,400 new jobs with average salaries exceeding $95,000.
Cap Rate Trends and Projections
Nevada multifamily cap rate compression accelerated through Q4 2025 as institutional buyers recognized value relative to California markets. The spread between Nevada and Orange County cap rates narrowed to 110-140 basis points, the tightest differential since 2021 peak pricing.
Forward-looking cap rate projections indicate continued compression through 2026, driven by rent recovery and sustained investment demand. Las Vegas Class A properties may compress to 4.9-5.1% by year-end 2026, while Henderson maintains its 20-40 basis point premium structure.
The 2024 cap rate expansion to 6.8-7.1% levels created the current opportunity for yield-focused investors. Supply absorption and rent recovery drive the compression cycle, with transaction volume increases providing validation of improved fundamentals.
Interest rate sensitivity remains a key variable in cap rate projections. Current pricing assumes 10-year Treasury stability around 4.2-4.5%. Each 50 basis point Treasury move typically translates to 20-30 basis points of multifamily cap rate movement in Nevada markets.
Comparative Yield Analysis
Nevada's yield advantage over California markets creates compelling cash-on-cash returns for leveraged acquisitions. Current Nevada Class B properties at 5.8-6.2% cap rates generate 12-16% levered returns with 75% LTV financing, compared to 8-11% returns on comparable Orange County assets.
The operational environment enhances these returns through reduced regulatory compliance costs and faster eviction timelines. Nevada's 7-judicial-day pay-or-quit period (NRS 40.253) and 5-day cure notice for lease violations (NRS 40.2516), combined with streamlined court processes, reduce bad debt expense by an estimated 40-60 basis points annually versus California properties.
Investment Strategy Considerations
Nevada multifamily investment strategy requires understanding the distinct risk-return profiles between Las Vegas and Henderson markets. Las Vegas offers higher absolute returns but requires active management of tenant quality and economic cycle exposure. Henderson provides stability with defensive characteristics but at compressed yields.
For multifamily investment tax strategy, Nevada's lack of state income tax enhances after-tax returns for individual investors. This advantage compounds over hold periods, particularly for California residents subject to 13.3% marginal state tax rates on rental income and capital gains.
Portfolio allocation between markets depends on investment objectives. Growth-oriented strategies favor Las Vegas workforce housing plays with 6.0-6.5% entry yields and 4-6% annual rent growth potential. Conservative approaches emphasize Henderson Class A assets with 5.4-5.8% yields but superior tenant retention and rent collection rates.

Due Diligence Focus Areas
Nevada multifamily due diligence emphasizes employment diversity analysis given the state's economic transition. Properties with tenant bases concentrated in gaming and hospitality require stress testing for recession scenarios. Conversely, assets serving professional services and healthcare workers demonstrate superior collection rates and retention.
Water rights and utility infrastructure represent unique Nevada considerations. Southern Nevada Water Authority allocations support current development but may constrain future supply growth. Properties with established utility capacity and water commitments command premium valuations.
HOA and master-planned community dynamics require careful analysis in Henderson deals. Well-managed community associations enhance property values but may limit operational flexibility. Review CC&Rs and association financials to identify potential assessment risks or restrictive rental policies.
Financing and Capital Markets
Nevada multifamily financing markets demonstrate strong lender appetite with competitive terms reflecting improved fundamentals. Agency debt remains most attractive for stabilized properties, with current Freddie Mac small balance loans at 6.8-7.2% for 10-year terms.
Bank financing offers flexibility for value-add strategies but requires Nevada market experience. Regional banks with Las Vegas presence provide 70-75% LTV at floating rates tied to Prime or SOFR. Construction-to-perm products are available but require pre-leasing commitments given recent supply concerns.
Private equity and opportunity fund capital increasingly targets Nevada markets, creating competition for institutional-quality deals. However, sub-$25M transactions remain accessible to individual investors and smaller syndicators with local market knowledge.
Debt Service Coverage Requirements
Lender underwriting standards reflect Nevada's market maturation with DSCR requirements of 1.20-1.25x for agency loans. Bank products may accept 1.15x DSCR for experienced sponsors with strong liquidity. These metrics assume T-12 operations rather than pro forma projections for stabilized properties.
Interest rate hedging becomes critical for floating-rate acquisitions given Fed policy uncertainty. Cap products cost 150-200 basis points annually for 300 basis point protection, but provide essential downside protection for leveraged cash flows.
Market Timing and Outlook
Nevada multifamily market timing favors current acquisition activity based on supply-demand rebalancing and rent recovery indicators. Concession activity declining from 68% to 42% of properties signals landlord pricing power restoration ahead of seasonal spring leasing.
The 18-month supply overhang that pressured 2024-2025 performance is largely absorbed, with effective occupancy rates returning to historical norms. Las Vegas stabilized occupancy averaged 94.7% in Q4 2025, up from 91.2% trough levels in Q2 2025.
Employment growth acceleration supports rent recovery projections. Nevada's 2026 job growth forecast of 3.8% exceeds national averages, driven by corporate relocations and infrastructure investments including Tesla Gigafactory expansion and Amazon fulfillment center development.
Risk Factors and Mitigation
Primary risk factors include interest rate volatility, California economic slowdown affecting migration patterns, and potential federal policy changes impacting Nevada's tax advantages. However, the state's economic diversification and business-friendly environment provide defensive characteristics.
Water availability represents a long-term constraint but not an immediate investment concern. Southern Nevada Water Authority conservation measures and Colorado River agreements support current demand through 2030. New construction faces greater restrictions than existing properties.
Gaming industry cyclicality remains relevant despite economic diversification. Monitor convention bookings and tourism metrics as leading indicators of potential employment disruptions affecting tenant demand in gaming-dependent submarkets.
Implementation Recommendations
For Orange County investors implementing Nevada allocation strategies, we recommend initial 60/40 weighting toward Henderson assets to establish market presence with defensive characteristics. This allocation captures Henderson's rent premiums while limiting exposure to Las Vegas economic volatility during initial market entry.
Target acquisition criteria should emphasize properties built post-2010 with professional management history and proven rent growth. Avoid assets requiring immediate capital expenditures given construction cost inflation and permitting delays that may extend renovation timelines.
Consider arizona vs california real estate taxes analysis when comparing Sun Belt alternatives. Nevada's tax structure provides advantages over Arizona's recent tax changes, though both offer significant benefits versus California's regulatory environment.

Portfolio Construction Approach
Optimal Nevada portfolio construction balances yield objectives with risk management through geographic and tenant diversification. Allocate 40% to Henderson Class A/B assets, 35% to Las Vegas workforce housing, and 25% to value-add opportunities across both markets.
This structure captures Henderson's stability, Las Vegas growth potential, and value creation opportunities while maintaining liquidity through market cycles. Avoid concentration in any single submarket or employment sector to reduce correlation risks.
Consider joint ventures or fund structures for initial Nevada exposure, particularly for investors unfamiliar with local market dynamics. Established operators provide operational expertise and regulatory navigation that enhance returns and reduce execution risk.
Conclusion and Next Steps
Nevada's multifamily market presents compelling opportunities for Orange County investors seeking yield enhancement and geographic diversification. Current cap rates of 5.2-6.8% offer meaningful spreads over California markets while providing access to superior operational environments and tax advantages.
The timing favors acquisition activity as supply-demand imbalances resolve and rent recovery accelerates through 2026. Henderson's defensive characteristics support core strategies, while Las Vegas provides higher-return opportunities for experienced multifamily investors comfortable with increased operational complexity.
Market fundamentals support continued cap rate compression as institutional recognition of Nevada's improved risk-return profile drives capital allocation. Early movers in this cycle benefit from current pricing before widespread California investor migration compresses yields further.
Implementation requires sophisticated market analysis, local operational expertise, and appropriate financing structures to maximize risk-adjusted returns. The opportunity represents Nevada's best entry point since 2022 for investors able to execute on current market conditions.
Frequently Asked Questions