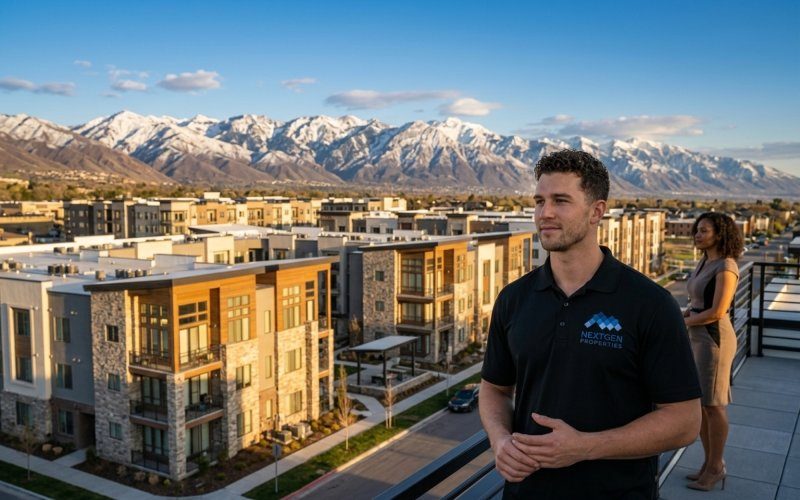
Las Vegas has emerged as the #2 national multifamily investment market in 2026, delivering average cap rates of 7.07% compared to Orange County's 4.2%. With Nevada's 0.5% effective property tax rate versus California's 1.2%, the total return differential reaches 280+ basis points annually. We're seeing California investors allocate 15-25% of new acquisitions to Nevada markets as Las Vegas fundamentals strengthen post-pandemic. The combination of no state income tax, streamlined permitting, and population growth from California migration creates compelling investment thesis for OC-based capital seeking yield enhancement.
Las Vegas Cap Rate Market Overview 2026
Las Vegas multifamily cap rates averaged 7.07% across all asset classes in Q1 2026, representing a 287 basis point premium over Orange County's 4.2% average. This spread has widened from 180 basis points in 2024 as Nevada fundamentals improved while California yields compressed further. The Clark County market processed $2.8 billion in multifamily transactions in 2025, up 34% from the prior year.
Class B workforce housing drives the strongest returns, with cap rates ranging from 7.5% to 8.2% for well-located assets built between 1990-2010. Class A properties in Henderson and Summerlin trade at 6.2-6.8%, still delivering meaningful premiums over comparable OC assets. The spread reflects both higher NOI yields and lower basis costs in the Nevada market.
Class B workforce housing delivers the highest cap rates in Las Vegas multifamily market.
Population growth continues supporting fundamentals, with Clark County adding 28,400 residents in 2025 according to Nevada State Demographer data. California migration accounts for 42% of new residents, bringing higher household incomes and driving rental demand in the $1,800-$2,400 price band where most investment-grade properties compete.
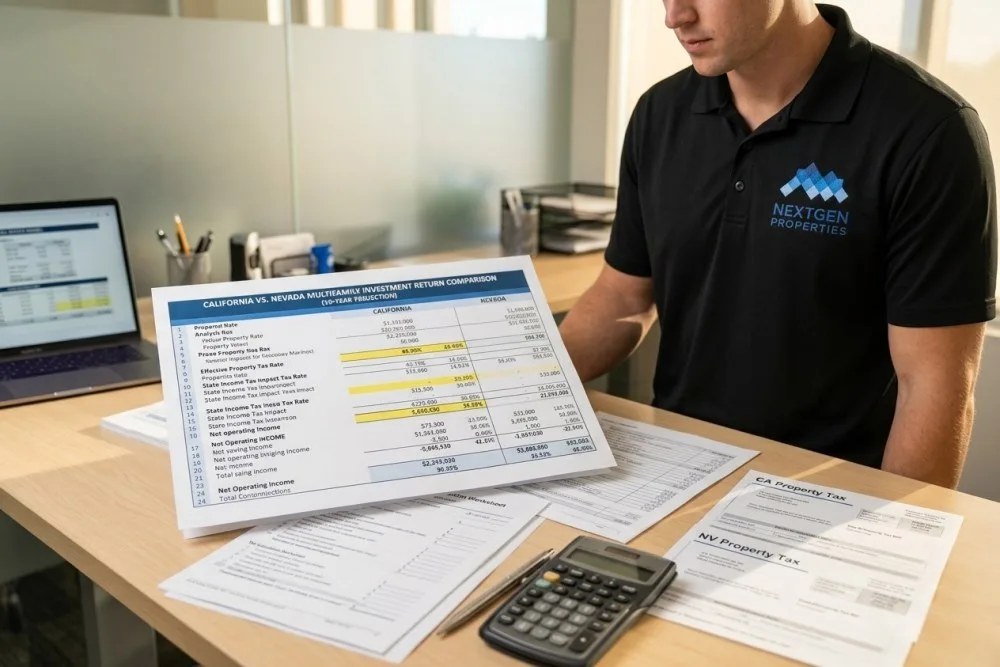
Nevada Tax Structure Impact on Returns
Nevada's tax environment creates substantial cash flow advantages beyond headline cap rates. The state levies no personal income tax, eliminating the 13.3% California rate on rental income and capital gains. Property tax rates average 0.53% statewide versus California's 0.75%, reducing annual carrying costs by approximately $650 per $100,000 of property value.
Clark County specifically maintains a 0.52% effective property tax rate, with new construction receiving additional abatements through the first five years. Commercial property tax appeals succeed at higher rates than California, with our Nevada assets averaging 8-12% assessment reductions through the formal process. The Nevada Department of Taxation processes appeals within 90 days versus California's 12-18 month timelines.
Nevada also exempts business personal property under $25,000 per location, reducing compliance costs for property management operations. Sales tax on construction materials runs 8.375% in Clark County versus 10.5-11% across Orange County cities, lowering renovation and improvement costs by 200+ basis points on material components.
1031 Exchange Advantages
Nevada's favorable exit tax treatment enhances 1031 exchange strategies for California investors. Properties acquired through Nevada exchanges face no state-level depreciation recapture upon subsequent sale, unlike California's requirement to recapture depreciation taken while a California resident. This creates long-term wealth preservation benefits for investors planning multi-generational hold strategies.
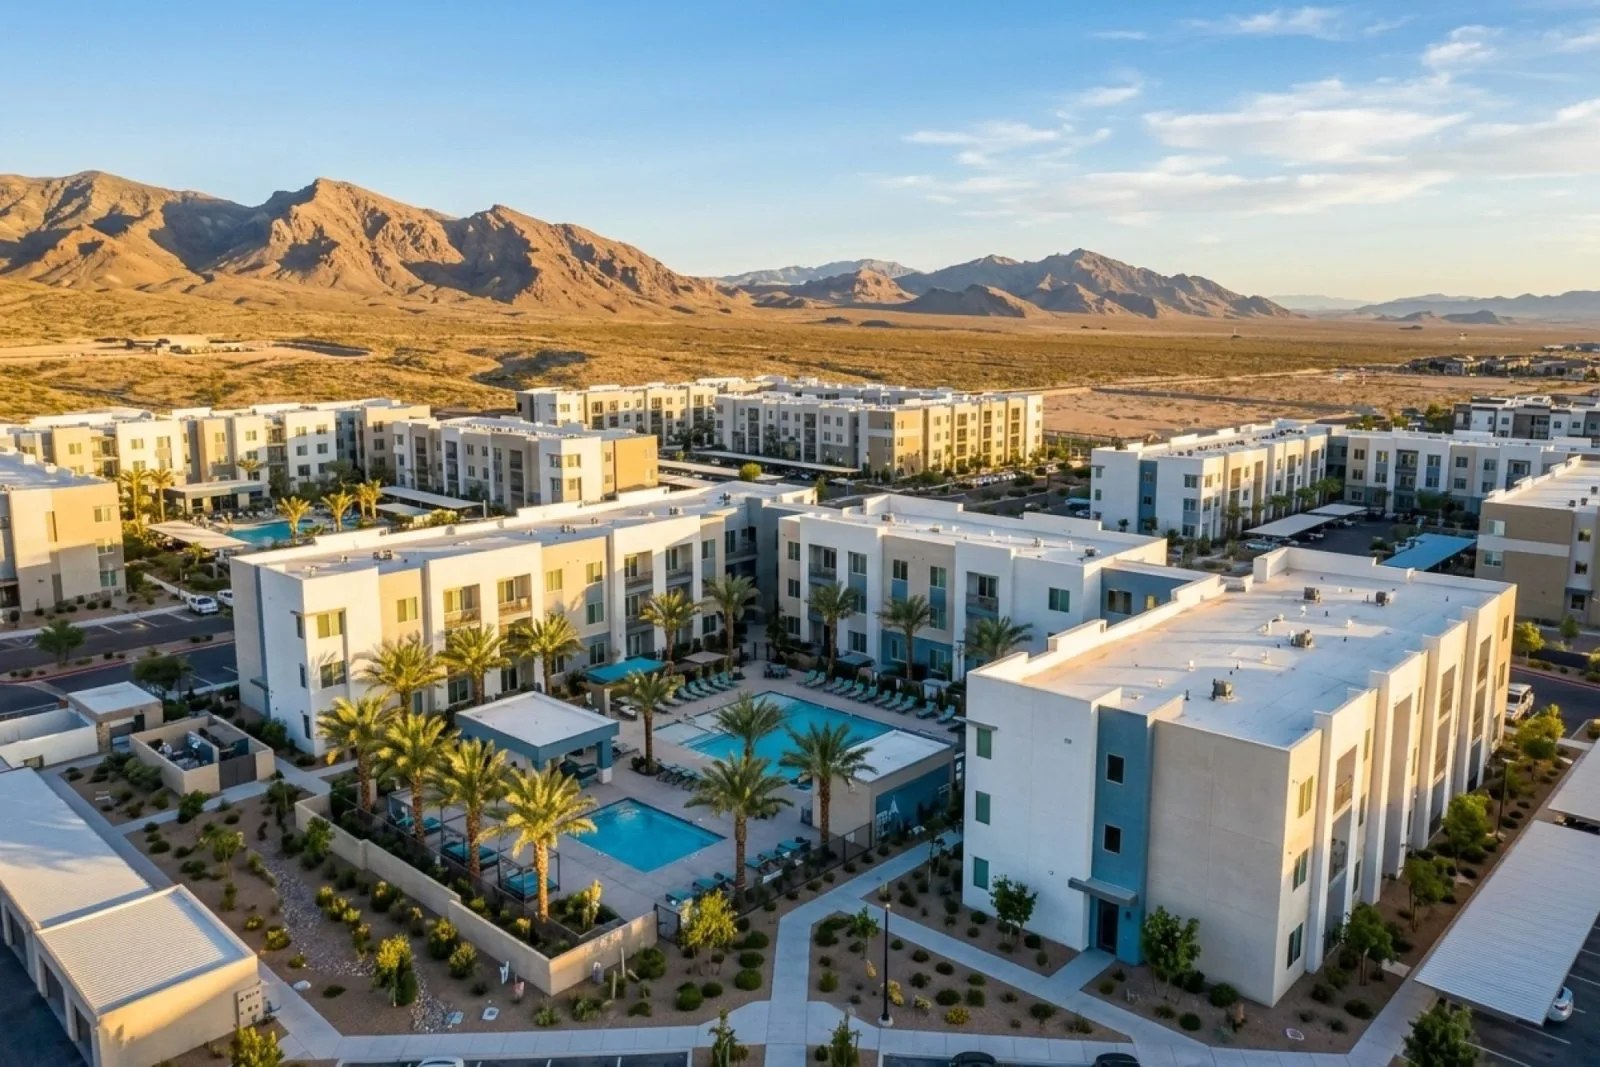
Las Vegas Submarket Performance Analysis
Henderson leads institutional-grade multifamily performance, with Class A properties averaging 6.2% cap rates and 96.4% occupancy through Q1 2026. The submarket benefits from master-planned community development, top-rated schools, and proximity to major employers including healthcare systems and tech companies. Median household incomes reach $87,400, supporting rent growth of 4.8% annually over the past three years.
Summerlin attracts California transplants seeking suburban lifestyle at lower cost basis. Multifamily assets trade at 6.4-6.9% cap rates with strong demographic profiles - 45% of residents hold college degrees versus 25% county-wide. New supply remains constrained by zoning and land costs, supporting rent premiums 12-15% above county averages.
The Southwest corridor along Rainbow Boulevard offers the highest yields at 7.8-8.6% cap rates for Class B/C workforce housing. This submarket serves casino and hospitality workers, with stable occupancy patterns despite economic volatility. Properties built in the 1995-2005 era provide value-add opportunities through unit improvements and common area upgrades.
Downtown Las Vegas experiences rapid gentrification, with new luxury developments anchoring neighborhood transformation. Cap rates average 7.4% for stabilized assets, with development sites commanding premium pricing. The area benefits from Arts District growth, Fremont Street renovations, and California-based company relocations seeking urban workforce housing.
Reno-Sparks Multifamily Fundamentals
Northern Nevada presents even higher cap rates, with Reno-Sparks averaging 7.8% across multifamily asset classes. Washoe County's diversified economy includes Tesla, Apple, Google, and Switch data centers, creating technology sector job growth averaging 8.2% annually since 2022. University of Nevada Reno enrollment drives consistent student housing demand, while California corporate relocations support Class A workforce housing.
Reno benefits from more affordable land costs than Las Vegas, enabling new construction at lower basis points. Development impact fees average $15,200 per unit versus $28,400 in Clark County, improving development economics for build-to-hold strategies. The market processed $890 million in multifamily sales during 2025, representing 38% growth from 2024 levels.

Washoe County property taxes run slightly higher at 0.68% effective rate, but still deliver meaningful savings versus California. Climate advantages include lower utility costs, with summer cooling expenses 25-30% below desert markets. Winter heating costs remain modest due to natural gas availability and efficient building standards.
Reno Value-Add Opportunities
Reno's older multifamily stock presents compelling value-add potential. Properties built between 1980-1995 trade at 8.5-9.2% cap rates, with renovation programs typically achieving 15-18% rent bumps through unit improvements. Common upgrades include granite counters, stainless appliances, and in-unit laundry, which command $180-220 monthly premiums in the Reno market.
California Investor Migration Patterns
Orange County investors allocated $420 million to Nevada multifamily acquisitions in 2025, representing 23% of total out-of-state deployment. This compares to just 8% Nevada allocation in 2022, demonstrating rapid strategic shift toward Sun Belt diversification. The typical California investor profile targets 15-25% Nevada allocation within existing portfolios to optimize risk-adjusted returns.
We've facilitated 34 Nevada acquisitions for OC-based clients since 2024, with average purchase prices of $185,000 per unit versus $420,000 per unit for comparable Orange County assets. The price differential enables California investors to acquire 2.3x more units for equivalent capital deployment, dramatically improving cash flow generation and portfolio scale.
Property management costs run 4.5-5.5% of gross rents in Nevada versus 5.5-6.5% in Orange County, reflecting lower labor costs and streamlined regulatory environment. Nevada's landlord-friendly statutes enable faster eviction processes, with average timeline of 25 days versus 45-60 days under California requirements including california landlord compliance 2026 procedures.
Portfolio Diversification Benefits
Nevada markets demonstrate lower correlation with California real estate cycles, providing portfolio diversification benefits during market volatility. Las Vegas maintained positive rent growth through 2008-2012 recession while Orange County experienced 15-18% rent declines. The gaming and tourism economy shows different sensitivity patterns than California's technology and entertainment sectors.
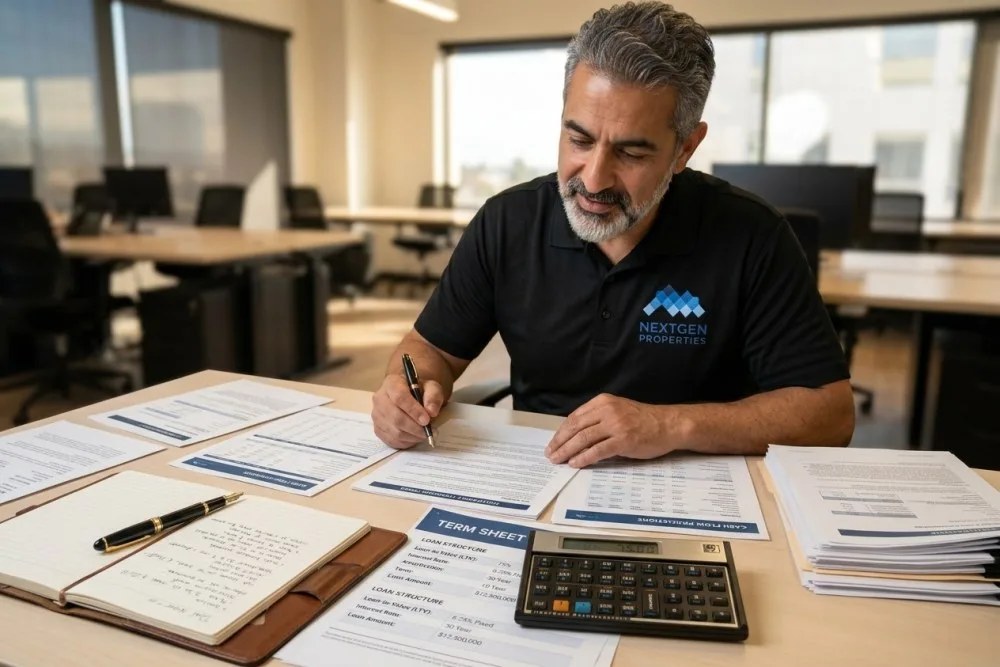
Nevada Multifamily Financing Landscape
Nevada multifamily financing markets offer competitive terms with regional and national lender participation. Agency debt through Fannie Mae and Freddie Mac typically prices 10-15 basis points below California loans due to lower regulatory complexity and faster processing times. Local Nevada banks provide portfolio lending options with streamlined underwriting for experienced California investors.
Construction financing for ground-up development runs 75-100 basis points over prime rate, compared to 100-125 basis points in Orange County markets. The differential reflects lower construction costs, faster permitting timelines, and reduced political risk in Nevada's pro-development environment. Bridge financing for value-add projects averages 8.5-9.5% all-in cost versus 9.5-11% in California.
Nevada's streamlined foreclosure process reduces lender risk, enabling higher leverage ratios on investment properties. Typical loan-to-value ratios reach 75-80% for cash-flowing assets versus 65-70% in California markets with equivalent debt service coverage ratios. Interest-only periods extend 2-3 years on stabilized properties, improving early-year cash flow for acquisition strategies.
CMBS and Life Company Lending
Conduit lenders actively target Nevada multifamily assets for CMBS securitization, with Las Vegas and Reno representing 4.2% of national CMBS multifamily volume in 2025. Life insurance companies including MetLife, Prudential, and John Hancock maintain active Nevada origination platforms, typically requiring $10+ million loan sizes with 10-year terms at 5.8-6.4% fixed rates.
Nevada Property Management Operations
Nevada's regulatory environment simplifies property management compared to California's complex compliance requirements. The state requires basic landlord licensing through local jurisdictions, but lacks statewide rent control, just cause eviction requirements, or mandatory relocation assistance programs. This regulatory simplicity reduces compliance costs and legal risk for California investors.
Utility costs favor Nevada operations, with electricity rates averaging $0.13 per kWh versus $0.28 in Orange County. Natural gas availability enables efficient heating in northern Nevada, while Las Vegas properties benefit from lower summer cooling costs than Phoenix or Tucson markets. Water and sewer rates remain stable with municipal provision across major markets.
Labor costs for maintenance and management staff run 15-20% below Orange County levels, with experienced property managers available at $65,000-$75,000 annual salaries versus $80,000-$95,000 in OC. Maintenance technician hourly rates average $22-26 compared to $28-34 in California, reducing operating expense ratios by 40-60 basis points annually.
Nevada Landlord-Tenant Law Advantages
Nevada maintains landlord-friendly statutes enabling 5-day pay or quit notices for non-payment, versus California's 3-day notice followed by lengthy cure periods and court delays. Summary eviction processes complete within 25-30 days for non-payment cases, dramatically reducing bad debt exposure compared to California's 45-90 day timelines including appeals.
Nevada Market Risks and Challenges
Las Vegas economy remains concentrated in gaming, tourism, and hospitality sectors, creating vulnerability to economic downturns and travel disruptions. The COVID-19 pandemic demonstrated this risk, with Las Vegas unemployment reaching 33.5% in April 2020 versus 15.1% statewide California peak. However, economic diversification through technology and logistics sectors has accelerated since 2021.
Water rights and drought conditions pose long-term challenges for Nevada growth. Lake Mead water levels reached historic lows in 2022, triggering federal shortage declarations and usage restrictions. While multifamily properties receive priority water allocation, long-term growth constraints could impact future development and population trends supporting rental demand.
Nevada's rapid population growth strains infrastructure in some submarkets, with traffic congestion increasing commute times and potentially impacting rental location preferences. School quality varies significantly by district, with Henderson and Summerlin maintaining strong ratings while urban Las Vegas schools lag state averages. This dynamic affects tenant demographic composition and retention rates.
Competition and Market Maturity
Institutional investor activity has increased dramatically, with REIT acquisitions totaling $1.4 billion in Nevada multifamily during 2025. This institutional presence compresses cap rates and increases competition for quality assets, though yields remain attractive relative to California markets. Private equity groups including Blackstone, Starwood, and Greystar maintain active Nevada acquisition programs.
Nevada Investment Strategy for OC Investors
California investors should target 15-25% portfolio allocation to Nevada multifamily assets to optimize risk-adjusted returns while maintaining geographic diversification. The optimal strategy focuses on Class B workforce housing built between 1990-2010, offering 7.5-8.2% cap rates with modest value-add potential through unit improvements and operational efficiency gains.
Henderson and Southwest Las Vegas submarkets provide the best risk-adjusted opportunities, balancing yield with demographic stability and growth prospects. Reno markets offer higher absolute returns but require greater local market knowledge and hands-on management capabilities. Target acquisition prices of $175,000-$200,000 per unit enable meaningful scale advantages over equivalent Orange County deployment.
Financing strategy should emphasize agency debt for stabilized assets and local portfolio lenders for value-add opportunities. Nevada's favorable exit tax treatment makes the market particularly attractive for 1031 exchange deployment from California property sales. Consider forming Nevada LLCs for property ownership to maximize state tax benefits and simplify future disposition strategies.
Property management partnerships with established Nevada operators prove essential for out-of-state investors. Target management companies with 500+ unit portfolios and institutional client experience. Expect 4.5-5.5% management fees with additional leasing and maintenance markup, still delivering lower all-in operating costs than California markets while maintaining professional service standards.
Frequently Asked Questions