OC multifamily vacancy hit 3.4% in Q1 2025 — the tightest reading since 2021. Coastal submarkets are even tighter. Rents are up 4.2% year-over-year. New supply remains constrained. Landlords who are still pricing below market are leaving real money on the table.
If you've been watching the Orange County rental market through the first half of 2025, you've seen something that hasn't happened since before the pandemic: vacancy rates tightening simultaneously across almost every submarket. Not just coastal cities. Not just luxury units. Across the board — from Anaheim to Aliso Viejo — the story is the same.
At NextGen Properties, we manage 750+ units across OC and five other states. What we see in our own portfolio mirrors what the broader data shows. This analysis draws on our operational data, CoStar Q1 2025 figures, and on-the-ground observations from leasing activity across the county.
“Vacancy is a lagging indicator. By the time it shows up in a report, smart landlords have already moved on rent.”
— Chris Kerstner, CEO, NextGen Properties
The Headline Numbers
OC multifamily vacancy came in at 3.4% in Q1 2025, down from 4.1% a year prior. That's the tightest reading since Q3 2021, when post-pandemic demand surge briefly pushed vacancy below 3%. Average effective rent across the county is now $2,847/month, up 4.2% year-over-year. The rent growth rate has actually accelerated slightly from Q4 2024's 3.8%.
New supply remains the constraint. Approximately 1,200 units are expected to deliver in OC in 2025, well below the 10-year average of around 2,400. The entitlement pipeline has been thin, and construction cost inflation has made many projects that penciled two years ago no longer viable. The net effect is that demand is running ahead of supply by a meaningful margin.
Click any bar for details. Coastal OC vacancy under 2.5% — tightest in the county. Inland markets 3.8–4.5%, still well below historical averages.
Submarket Breakdown
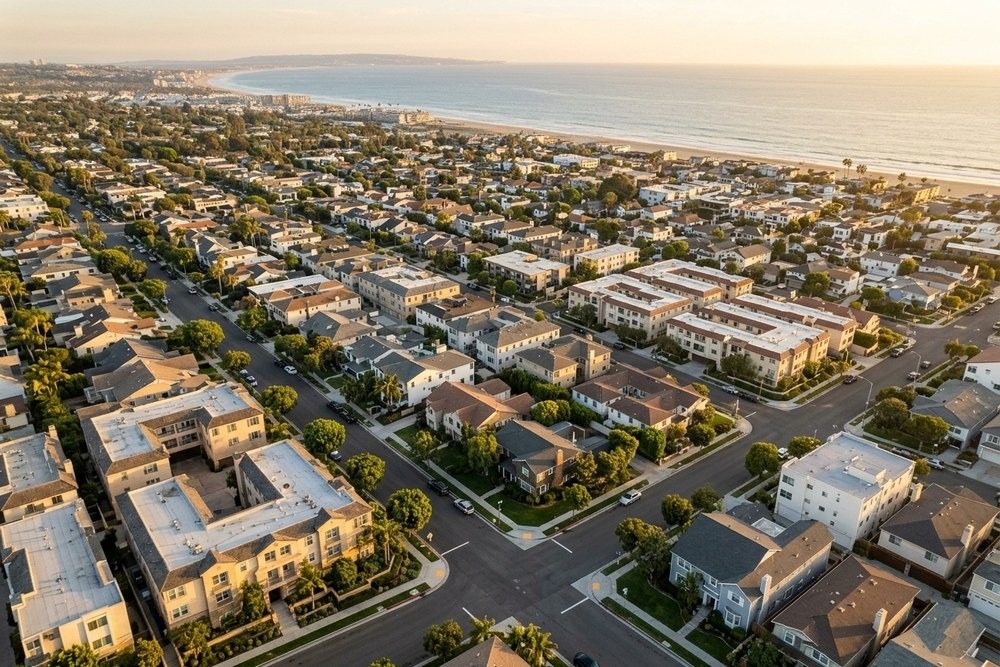
Coastal (Newport Beach, Laguna, Huntington Beach): Vacancy under 2.5% across all three. Rents averaging $3,400–$4,200/month for 2-bedrooms. Leasing velocity is fast — well-priced units in these markets are receiving multiple applications within days. Cap rates are compressed at 3.8–4.2%, making these appreciation plays rather than yield plays.
Coastal 2BRs average $3,400–$4,200/month; inland markets run $2,100–$2,500. The submarket you choose determines your yield, your tenant profile, and your management intensity.
Core OC (Costa Mesa, Irvine, Santa Ana): Vacancy averaging 3.1–3.6%. Irvine continues to benefit from tech employment and high-quality schools driving family renter demand. Costa Mesa is one of the most dynamic submarkets in the county — lower price point than Newport, strong walkability scores, and a young professional demographic that prioritizes location over space.
Inland (Anaheim, Fullerton, Orange, Garden Grove): Vacancy in the 3.8–4.5% range, still tight by historical standards. Rent growth of 3.5–4.8% year-over-year. These markets offer better yield at 4.8–5.5% cap rates, with value-add opportunities still available from individual owners who haven't optimized operations.
Unit Type Dynamics
Studios and 1BRs are seeing the sharpest rent growth. OC has chronically underbuilt smaller units, and remote work consolidation is pushing singles back into city-adjacent areas. Three-bedroom units show softer conditions in inland areas where they compete with for-sale SFR alternatives.
What This Means for Investors
1. Pricing power is real — use it carefully. California's AB 1482 caps increases at 5% + local CPI (up to 10% maximum) for most OC cities. Our data shows landlords who price at market and renew tenants retain 60%+ more NOI over a 5-year hold.
2. Coastal assets are appreciation plays. Newport and Laguna trade at 3.8–4.2% cap rates. Negative leverage is the cost of entry. If yield is primary, look at Costa Mesa, HB, and South OC corridors at 4.5–5.5%.
3. Operations are the differentiator. In a tight market, the landlords capturing the best tenants win on product quality and response speed. This is where professional management compounds.
Frequently Asked Questions