Orange County apartment vacancy sits at approximately 4.2% heading into mid-2026 ? above the 2.8% cycle low of late 2022, but well below the national average of 6.1%. The headline masks wide submarket divergence: coastal cities like Huntington Beach and Newport Beach are still running sub-3%, while Irvine''s Class A corridor is closer to 5% due to recent new supply deliveries. For investors and operators, reading the submarket map correctly is the difference between a deal that pencils and one that bleeds.
OC Vacancy Overview: 2026 Snapshot
Orange County has been one of the tightest apartment markets in the western United States for most of the past decade. Structural undersupply, high homeownership costs that keep renters renting longer, and a professional-class employment base anchored by life sciences, aerospace, and financial services have all kept vacancy below the national norm.
Heading into mid-2026, the overall OC vacancy rate is approximately 4.2% across stabilized market-rate inventory. That is up from the historic lows of 2.8–3.1% seen in 2021–2022, largely driven by the delivery of new Class A product over the past 18 months. It remains roughly 200 basis points below the national apartment average, and tighter than competing Southern California markets including the Inland Empire (6.8%) and Los Angeles county at large (5.9%).
The more important data point for operators is not the headline — it is the direction of travel by submarket and product class, which is where the real opportunities and risks are hiding in 2026.
Submarket-by-Submarket Breakdown
Orange County’s 34 cities span roughly 800 square miles of land and house more than three million residents, making submarket differentiation essential for any underwriting exercise. Below is a breakdown of vacancy conditions across the major OC rental nodes as of Q1 2026.
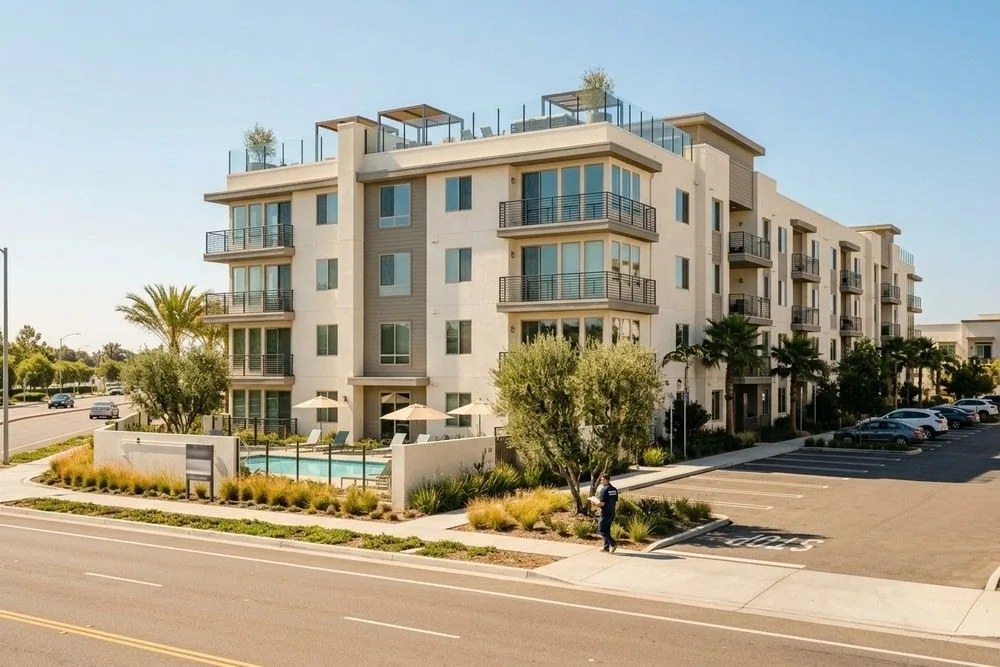
Irvine’s new supply wave pushed vacancy to a post-2009 high. Coastal and south OC remain the tightest rental nodes in the region.
| Submarket | Vacancy Rate |
|---|---|
| Newport Beach / Laguna Beach | 2.8% |
| San Clemente | 2.9% |
| Santa Ana | 3.2% |
| Huntington Beach | 3.3% |
| Costa Mesa | 3.8% |
| South OC Corridor | 3.8% |
| Anaheim | 3.9% |
| OC Overall Average | 4.2% |
| Irvine (Class A) | 5.1% |
| National Average | 6.1% |
Coastal Belt: Newport Beach, Huntington Beach, Laguna Beach
The coastal corridor remains the tightest rental zone in OC. Newport Beach and Laguna Beach both register vacancy below 2.8%, driven by near-zero land availability for new apartment construction and persistent demand from high-income renters who cannot or will not carry a $3M+ ownership home. Huntington Beach, which has a more diverse rental stock, runs approximately 3.3%. Effective rents in these markets have continued to push modestly higher — 2–3% year-over-year — even as the broader market has softened.
Mid-County Core: Irvine, Costa Mesa, Santa Ana
Irvine is the submarket to watch most carefully in 2026. The city’s planned Great Park Neighborhoods development continues to deliver new Class A units, pushing Irvine vacancy to approximately 5.1% — the highest point since the 2009 recession. Absorption has been adequate but not exceptional, and concessions of one to two months free rent on new leases are present at several Class A properties in the Spectrum and Great Park corridors.
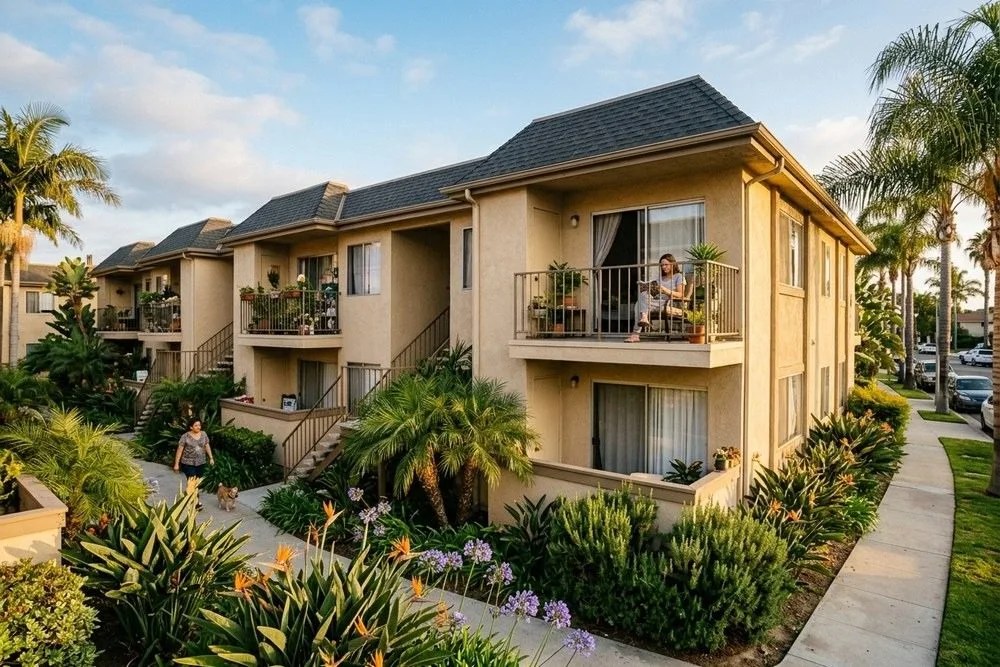
Costa Mesa sits at approximately 3.8% vacancy. The Eastside and South Coast Metro areas benefit from walkability to employment and retail, and older 1970s–1990s stock is performing particularly well as renters priced out of new product fall back to well-maintained workforce housing. This dynamic is something NextGen Properties has observed directly across our Costa Mesa portfolio: value-add product is seeing strong demand and minimal concession pressure.
Santa Ana, which houses a large share of OC’s workforce-housing stock, is running approximately 3.2% vacancy. Renter demand in this submarket is highly price-sensitive, but undersupply of quality affordable units keeps occupancy strong for operators who maintain their properties well.
North OC: Anaheim, Orange, Fullerton
North Orange County presents a bifurcated picture. Anaheim’s resort-adjacent rental stock — the Platinum Triangle and West Anaheim — is performing well, with vacancy near 3.9%, supported by hospitality-sector employment recovery and relatively limited new supply. The city of Orange and Fullerton, which together host significant university-adjacent rental demand from Chapman University and Cal State Fullerton, are both running in the 4.0–4.5% range.
South County: Mission Viejo, Lake Forest, San Clemente
South OC’s master-planned communities have historically seen lower vacancy than the county average. Vacancy across the Mission Viejo–Lake Forest corridor runs approximately 3.5–4.0%. San Clemente, which benefits from coastal desirability and limited multifamily stock, remains among the tightest submarkets in the county at approximately 2.9%.
New Supply and Absorption
The 2024–2026 delivery pipeline has been the primary driver of the modest vacancy increase OC has experienced from its 2022 cycle lows. Approximately 6,200 new market-rate apartment units delivered across OC in 2024–2025, concentrated heavily in Irvine (38%), Anaheim/Platinum Triangle (22%), and the Tustin Legacy corridor (15%).
This is not a supply crisis — OC still delivers far fewer units per capita than peer markets like Dallas, Phoenix, or Denver — but it has been enough to give tenants in Class A product meaningful negotiating leverage for the first time since 2019. Absorption rates on new deliveries have slowed from the 95%+ lease-up velocity of 2021–2022 to a more normalized 15–20 units per month per property, extending average stabilization timelines from 12 to 18 months.
The forward pipeline is constrained. Entitlement timelines in OC average 18–36 months, construction costs have not meaningfully declined from 2022–2023 highs, and land values remain elevated. Fewer than 3,800 units are currently under construction county-wide as of Q1 2026, the lowest pipeline level since 2017. This suggests the current period of modest softness in Class A product is cyclical and likely to reverse as new deliveries thin out in 2027.
Vacancy and Rent Growth Correlation
In a market with vacancy below 5%, landlords generally retain meaningful pricing power — the classic inflection point where concessions become common is typically 6–7% vacancy in most US markets. Orange County has not approached that threshold in any submarket except Irvine’s Class A corridor.
The practical implication: value-add and workforce Class B/C properties across most of OC are continuing to see 3–5% annual effective rent growth in 2026, even as Class A product in Irvine and the Platinum Triangle is experiencing flat-to-slightly-negative effective rent growth after concessions are factored in.
For investors underwriting value-add acquisitions, pricing for vintage 1980s–2000s product should reflect the continued strong demand for workforce housing, while Class A pro formas in high-supply submarkets deserve more conservative rent-growth assumptions — particularly in years one and two of the hold period.
Strategy for OC Operators and Investors
Prioritize coastal and mid-county Class B/C acquisition. The vacancy and rent dynamics are most favorable for workforce housing in Costa Mesa, Santa Ana, Huntington Beach, and south OC. These assets are also less affected by the new supply pipeline. Cap rates have compressed, not expanded, in these submarkets over the past 12 months.
Be selective in Irvine Class A. Irvine remains an excellent long-term market, but the near-term absorption environment warrants conservative underwriting. Buyers should model 5.5–6.0% stabilized vacancy, 18-month lease-up timelines on new product, and one month of average concession in year-one projections. Bridge lenders are already requiring additional reserves on Irvine Class A deals.
Use submarket vacancy data actively in lease renewal negotiations. Properties in sub-4% vacancy markets have leverage to push 4–6% renewal increases. Properties in the 5%+ zone should focus on retention over aggressive renewal bumps — replacing a resident in a softening market costs 1–2 months of rent in turnover, lost income, and make-ready costs combined.
Track the Tustin Legacy and Platinum Triangle deliveries. These two corridors will see the most continued new supply pressure through mid-2026. Operators with properties within a one-mile radius of major new deliveries should actively monitor lease-up velocity at competing properties and be prepared to match concessions if absorption stalls.
12-Month Vacancy Outlook
The base-case outlook for OC apartment vacancy through Q1 2027 is stable-to-slightly-improving overall, with meaningful submarket divergence continuing. The delivery pipeline thins materially in the second half of 2026, which should remove the primary headwind for Class A lease-up velocity. Employment growth in OC — particularly in the life sciences corridor anchored by the Irvine Spectrum and UCI Medical Center — remains solid, underpinning renter demand across income levels.
Our best estimate: overall OC vacancy settles in the 4.0–4.5% range through year-end 2026, with coastal and south OC submarkets improving toward 3.0–3.5% as new supply thins, and Irvine Class A lingering in the 5–6% zone until the final 2024–2025 deliveries fully stabilize. For operators with well-located, well-maintained product in the right submarkets, this remains one of the strongest multifamily environments in the country.
Frequently Asked Questions