San Diego delivered 6,400 units in 2025?a 52% increase from 2024 marking the highest delivery volume in 25 years. This supply surge pressured rents downward by 1.9% in 2025, but created clear entry opportunities as deliveries will cool from the 2025 peak while outpacing the trailing five-year average by 41%. The market is rebalancing with renter demand expected to narrow the gap with inventory growth, keeping vacancy increases modest while cap rates remain stable near 4.5%, consistent with levels since early 2023.
2025 Supply Peak: Record Deliveries Drive Market Reset
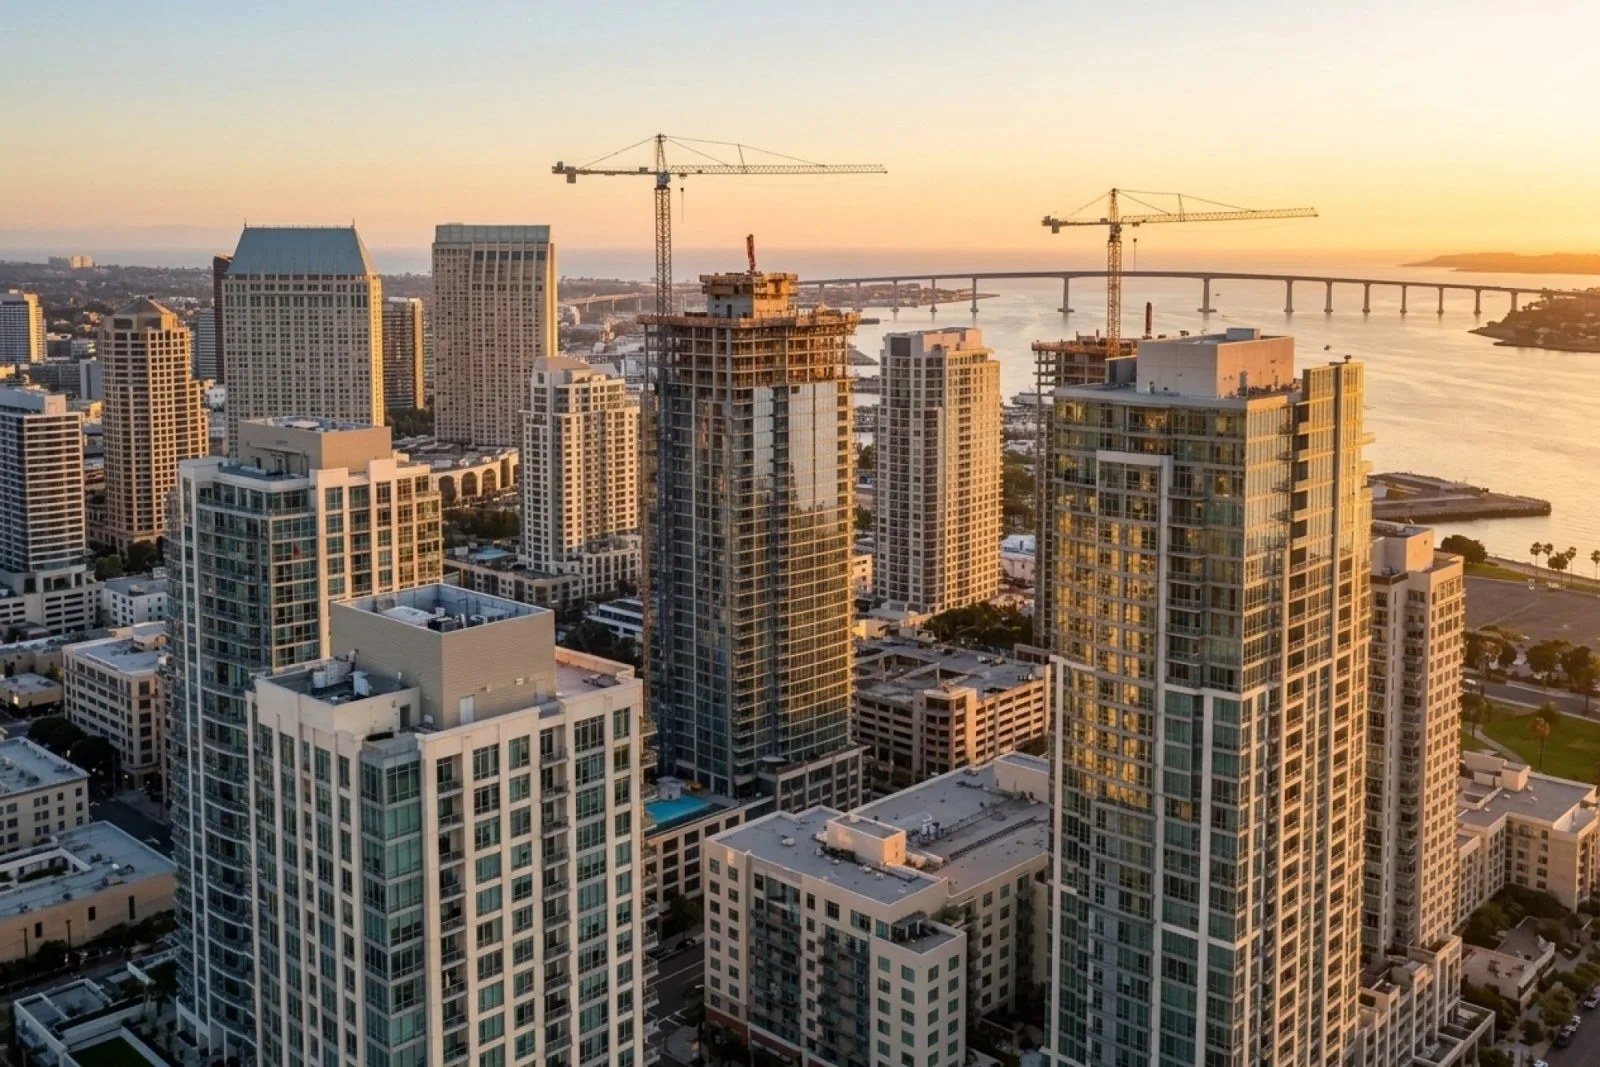
San Diego experienced a monumental supply surge in 2025, with roughly 6,400 units coming online—a 52% increase from 2024 levels. This represents the highest delivery level in 25 years, fundamentally shifting market dynamics and creating the supply-demand imbalance we're analyzing today. The scale of this delivery surge cannot be understated: it effectively doubled the typical annual supply addition that San Diego has averaged historically.
In 2025, new multifamily supply was the second highest since 2008, surpassed only by 2024. However, extended construction timelines delayed some projects, pushing completion into 2026, with garden-style projects taking an average of 694 days and mid-rise developments requiring 839 days. These delays created the concentrated delivery surge that operators are managing through aggressive leasing strategies.
The immediate market response was predictable: competitive leasing conditions put downward pressure on rents, with asking rents declining 1.9% in 2025, offsetting rent growth recorded in 2024. However, San Diego has historically been resilient to significant changes in occupancy, and the current adjustment reflects temporary rebalancing rather than fundamental weakness.
What makes this cycle different from typical oversupply scenarios is the composition of new inventory. Most new supply is concentrated in 4- and 5-Star luxury product, with vacancy in that category climbing to 12%. Meanwhile, older, well-located 2- and 3-Star inventory has not experienced the same degree of stress, creating distinct opportunity sets by asset class.
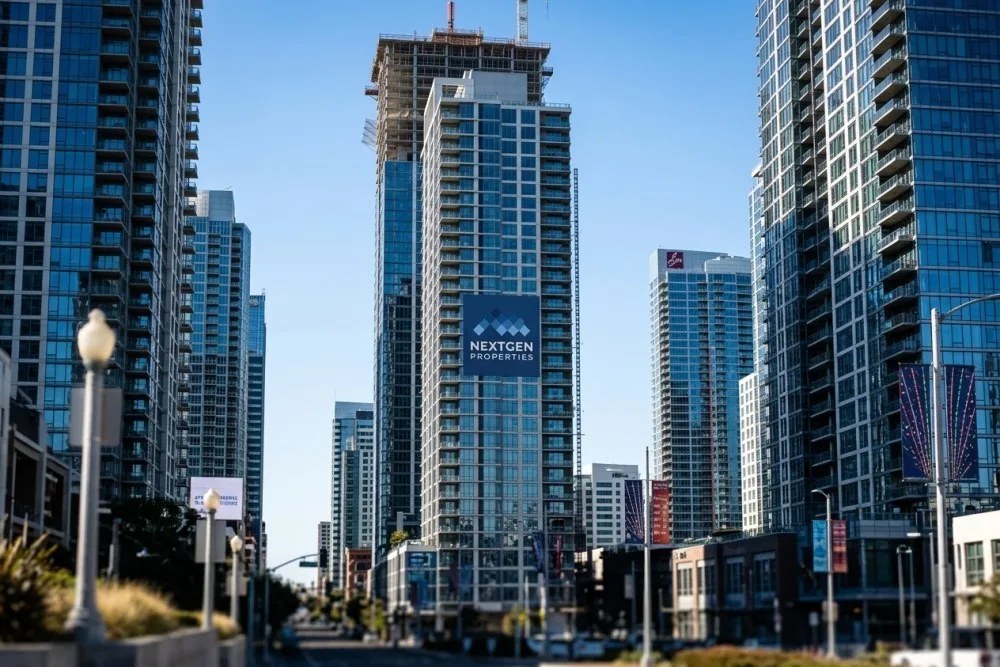
Construction Pipeline: Peak Behind, Moderation Ahead
The construction pipeline tells the story of market normalization ahead. The under-construction pipeline contracted 7.2% year-over-year following substantial growth in 2022 and 2023, with construction starts seeing a 40% drop in 2024 to only 298,023 units. This represents a fundamental shift in development activity that will reshape supply patterns through 2026-2027.
Units under construction declined to 11,323 units, a 24% year-over-year decrease, providing clear visibility into moderating supply pressure. Current pipeline data shows 7,900 units remain under construction, but new starts have already slowed significantly, suggesting the current pipeline may represent a peak.
Multifamily construction is not expected to slow drastically, though it should continue to taper off in the next few years. The key insight for investors is timing: once inventory growth falls closer to historical norms, vacancy should stabilize and rent growth will resume. This creates a clear inflection point for strategic acquisitions.
Geographic concentration of remaining pipeline matters for submarket analysis. Over 4,000 new market-rate units are projected for 2026, but much of the new construction will concentrate in specific growth corridors, leaving adjacent areas with little new supply and more rent pressure. This pipeline concentration creates micro-market opportunities for investors who understand submarket-specific supply dynamics.
Supply-Demand Rebalancing Timeline
While deliveries will cool from the 2025 peak, they are forecast to outpace the trailing five-year average by 41%, but renter demand is expected to narrow the gap with inventory growth. The rebalancing progression follows this timeline:
2026: Asking rents will likely trend lower, but decreases should be light. Vacancies will likely average about 100 basis points above historical levels of 3.5-4.0%.
2027+: Concessions expected to remain widespread well into 2026, with return to long-term average pace not anticipated until 2027. This extended normalization period provides acquisition windows for value-focused investors.
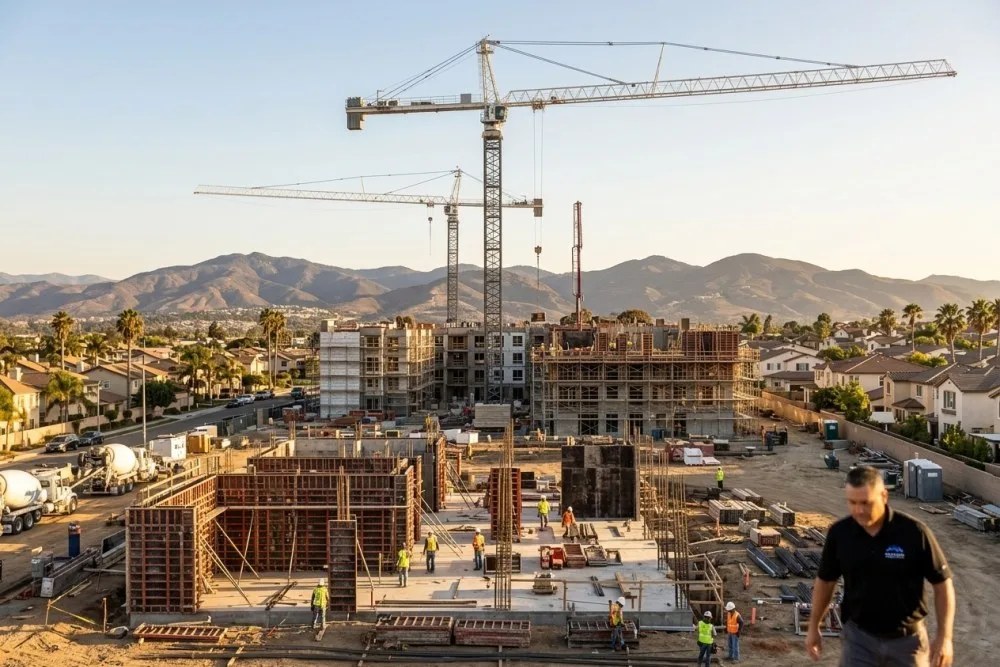
Submarket Performance: Divergent Trends Create Opportunities
San Diego's supply-demand story varies dramatically by submarket, creating distinct investment strategies based on local dynamics. While the market as a whole posted steady performance, there have been divergent trends across submarkets.
Chula Vista/Imperial Beach: Supply Leader, Price Growth
The Chula Vista submarket contained the greatest share of new units while rents decreased and vacancy rates inched 10 basis points higher. However, despite elevated supply, it remains a "hot spot" with median price per unit rising 38% to $409,500. This pricing strength amid supply pressure demonstrates underlying demand resilience.
Chula Vista/Imperial Beach is positioned for increased investment activity, as it's typically among the most active submarkets. The combination of supply absorption and institutional interest creates opportunities for value-add acquisitions at entry pricing below recent peaks.
La Jolla/University City: Vacancy Improvement
La Jolla/University City posted the strongest vacancy improvement, falling 50 basis points over the past 12 months. This performance reflects the submarket's proximity to major employment centers and limited land availability for new construction. The UTC corridor benefits from tech and biotech employers, high walkability, and limited land, presenting promising growth due to proximity, scarcity, and consistent demand.
East County: Transaction Volume Leader
East County continues to capture the highest share of sales activity, with modest rent increases recorded in the El Cajon/Santee/Lakeside submarkets even during the broader rent decline period. This demonstrates the submarket's workforce housing appeal and relative supply discipline.
Downtown San Diego: Recovery Positioning
Downtown San Diego is expected to regain its position as one of the most active submarkets for investment in 2026. Downtown vacancy, which surged above 10% in 2024, has eased slightly as new deliveries leased up, though average rents of $3,150/month remain down 4.2% year-over-year with oversupply impact concentrated in studios and 1-bedrooms.
The downtown recovery story centers on unit mix optimization. 3-4 bedroom condos/townhomes posted positive rent growth in 2025, reflecting demand from higher-income renters seeking space, while smaller units face continued pressure from luxury oversupply.
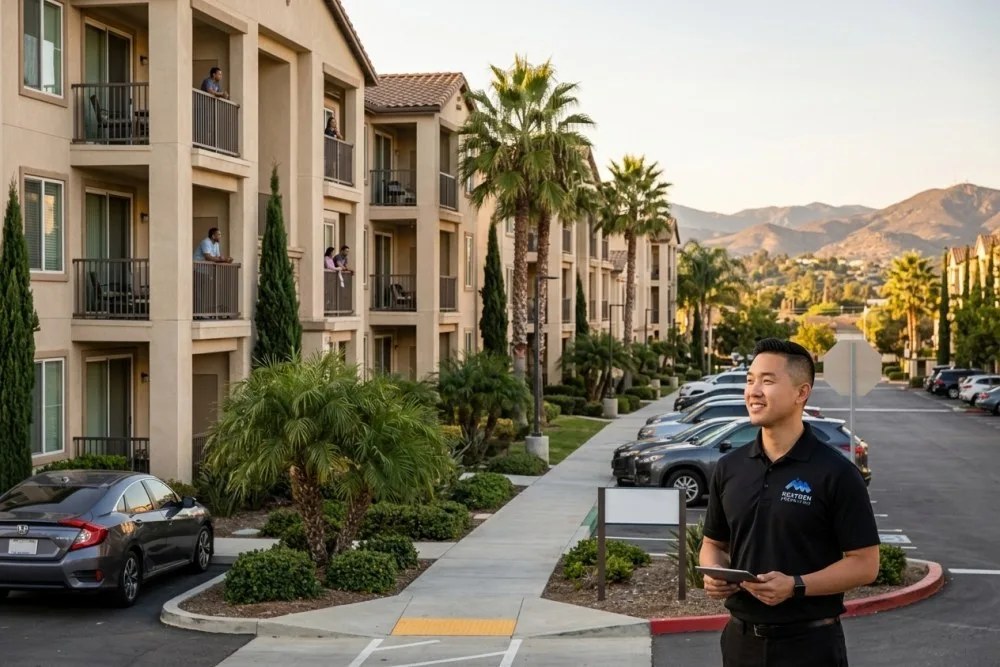
Demand Fundamentals: Employment & Population Drivers
San Diego's demand fundamentals remain remarkably strong despite temporary supply-demand imbalance. The region's economic diversification provides multiple demand pillars that support long-term apartment demand across cycles.
Employment Growth & Sectors
San Diego remains one of the top U.S. biotech hubs (ranking 3rd nationally), with Bio-Data Science and Genomics seeing massive investment despite general tech cooling, driven by breakthroughs in RNA technology and AI-driven drug discovery from local giants like Illumina. The metro will add 10,000 new jobs in 2025, with growth led by higher education, healthcare, and biotech sectors.
Clean Energy, specifically Fusion, is emerging as a high-growth sector, with General Atomics and startups positioning San Diego to lead the "Fusion Race," projecting up to 43,000 new jobs in this ecosystem over the next decade. This represents a new demand driver beyond traditional tech and biotech employment.
The tech talent workforce has grown to 78,860, with a 12.5% increase in five years, while 16,000 new tech jobs are coming by 2030, with 16.5% job growth projected. Nearly 2,000 tech companies generate $56 billion economic output, with entry-level positions starting around $25/hour and job market growing 15% faster than national average.
Income Growth Supporting Rent Growth
San Diego boasts the nation's highest wage growth at 4.8%, with median area income surging 39% from $86,300 in 2019 to $130,800. This robust income growth directly supports rental rate increases and demand for higher-quality multifamily products.
The income-to-rent relationship supports the market's premium pricing power. Even during the current supply surge, asking rents average $2,500 per unit with only 0.2% year-over-year growth—a temporary pause rather than fundamental affordability breakdown.
Population & Demographics
With Millennials and Gen Z comprising 56% of the population, San Diego ranks second in the U.S. for millennial concentration, behind only Austin, creating a natural and growing renter pool supported by 10 major higher education institutions and 150,000 military employees.
Multi-billion-dollar expansions of San Diego State University and UC San Diego, set to increase enrollment by over 20,000 students, will further strengthen rental demand. This education-linked demand provides stability during economic cycles.
Investment Pricing: Cap Rates, Pricing & Institutional Activity
San Diego's investment market demonstrates remarkable pricing stability despite the supply surge, reflecting institutional confidence in long-term fundamentals. Cap rates remain stable near 4.5%, consistent with levels observed since early 2023.
Cap Rate Compression & Stability
As of May 2024, the average cap rate for multifamily property sales in San Diego is 4.6%, and just 4.4% for 4-5 star properties according to CoStar. National multifamily cap rates average 6.0%, but San Diego's robust job market and economic fundamentals drive cap rates lower, with most deals transacting at sub-5% cap rates.
As of February 2025, San Diego multifamily has a median sold cap rate of just 4.3%, notably lower than the 6.1% national average, though recent trends suggest softening in prices. Cap rates remained remarkably steady throughout 2025, hovering between low-4% and low-5% range averaging around 4.5%, with no significant shifts expected for 2026.
Pricing Per Unit & Transaction Volume
Average price per unit over the past 12 months is $362,097, with coastal and core submarkets trading at lower cap rates and higher price per unit. However, median price per unit is down 5% at $333,300, due to softer prices across Class B properties, creating entry opportunities in the value-add segment.
Investor confidence mirrors strong fundamentals, with $2.2 billion in sales volume, average price per unit of $403,000, and cap rates at 4.7%. Transaction volume totaled $188 million in Q3 2025, with assets trading at an average of $184,000 per unit and cap rates rising to 5.7%, reflecting elevated vacancy and rent declines in specific asset classes.
Institutional Capital & Investment Activity
Institutional capital remains active, with the region continuing to attract institutional investment. Investors like Blackstone have poured over $1 billion into San Diego's multifamily market over the past five years, attracted to stability and long-term capital appreciation potential.
Even as interest rate hikes in 2022-2023 cooled investor appetite nationwide, San Diego continued to see large multifamily transactions, often involving institutional buyers like pension funds and REITs. In early 2025, MG Properties completed one of San Diego's largest single-property apartment transactions with its $309 million acquisition of the 718-unit Park 12 from Greystar.
While institutional capital focuses on 100+ unit properties, smaller 2-50 unit properties experience less competition, creating unique opportunities for private client and sub-institutional investors to capitalize on appreciation trends with higher yield potential.
Investment Opportunity Analysis: Timing & Strategy
The current supply-demand imbalance creates distinct opportunity windows for different investor profiles. The key insight is that market normalization creates multiple entry points depending on strategy, risk tolerance, and capital deployment timeline.
Near-Term Opportunities (2026)
Pricing adjustments and higher yields have drawn selective interest, though many buyers continue to take a wait-and-see approach as the market works through supply pressures. This creates opportunities for decisive investors willing to acquire during temporary dislocation.
The market-wide average time to sell is 5.6 months—longer than 2021 but not abnormal historically, providing negotiation leverage for qualified buyers. Properties priced without regard to lender constraints tend to sit longest, creating value opportunities in well-located assets with motivated sellers.
With pricing still adjusting, investors are likely to remain selective, targeting areas with stable yields and long-term rent growth potential. The emphasis shifts to operational upside and submarket fundamentals rather than broad market appreciation.
Asset Class Strategy
Luxury 4 & 5 Star vacancy has climbed to approximately 12%, while older 2-3 Star inventory—often workforce housing—has experienced more stable occupancy. This creates clear bifurcation in opportunity sets:
Luxury Assets: Highest concession pressure but strongest long-term appreciation potential as supply moderates. Entry pricing reflects temporary dislocation rather than fundamental value impairment.
Workforce Housing: More stable cash flows during adjustment period, with less volatile occupancy and rent growth. Appeals to value-focused investors prioritizing current income over appreciation.
Submarket Entry Strategy
Geographic targeting becomes crucial given submarket divergence. Priority submarkets for 2026 acquisition:
Primary Targets: UTC/Sorrento/Carmel Valley corridor, Mira Mesa/Rancho Peñasquitos, and Downtown/East Village stand out as most promising areas for rent growth recovery.
Value Opportunities: East County submarkets with transaction volume leadership and stable workforce housing demand patterns.
Recovery Plays: Downtown San Diego positioning for 2026 activity rebound as luxury supply absorbs and market rebalances.

Risk Factors & Investment Considerations
While San Diego's fundamentals remain strong, investors must navigate specific risks associated with the current supply-demand adjustment period. Understanding these factors enables appropriate underwriting and risk mitigation strategies.
Regulatory & Policy Risks
Despite robust demand-side fundamentals, investors remained cautious due to ongoing regulatory challenges. California's evolving tenant protection framework requires ongoing compliance monitoring, particularly during market adjustment periods when tenant-landlord dynamics intensify.
AB 1482 rent control provisions remain in effect through 2030, capping annual increases at 5% plus CPI. During periods of high inflation or rapid market rent growth, this constraint can limit NOI growth potential. However, current market conditions show rents declining rather than being constrained by caps, reducing near-term regulatory risk.
Construction Cost & Development Pressures
Construction costs remain historically high, interest rates are elevated relative to 2021-2022 levels, and financing for new projects is more restrictive. While this reduces new supply competition, it also constrains value-add renovation budgets and limits development exit strategies.
The cost environment supports existing asset values by creating barriers to new competition, but investors must underwrite renovation and repositioning projects conservatively given elevated labor and material costs.
Interest Rate & Financing Considerations
Cap rates have risen slightly in response to elevated interest rates, but impact on San Diego property values has been modest, as there's expectation of significantly discounted deals that's just not happening—everybody's holding their chips looking for opportunities to strategically deploy them.
The stable cap rate environment amid rising interest rates creates compressed spreads between borrowing costs and yields. Interest rates are moderately above cap rate levels for most commercial debt, creating a narrower spread between borrowing cost and yield. This emphasizes the importance of all-cash acquisition strategies or favorable debt structuring.
Market Timing & Cycle Considerations
Short-term supply pressure does not eliminate long-term demand drivers—markets that normalize are stronger than markets that remain overheated. However, investors must calibrate expectations for return timelines given the extended normalization period projected through 2027.
The current cycle differs from typical real estate downturns because it's driven by oversupply rather than demand destruction. This creates different risk-return profiles and recovery patterns compared to recession-driven market corrections.
2026 Investment Strategy & Action Plan
The San Diego multifamily market presents clear strategic opportunities for investors willing to act during the supply-demand rebalancing period. Success requires matching investment strategy to market timing and submarket-specific dynamics.
Immediate Actions (Q2-Q3 2026)
Market Research: Focus deal sourcing on submarkets with strong employment anchors and limited pipeline additions. Older or peripheral areas with higher vacancy will see slower rent growth, while neighborhoods near major job centers maintain faster absorption rates.
Underwriting Discipline: Prioritize operational upside over speculative appreciation. Current market rewards investors who can add value through management efficiency, unit mix optimization, and amenity enhancement rather than relying on market rent growth.
Financing Strategy: Consider variable-rate debt or shorter-term fixed structures given potential for rate declines in 2026-2027. Apartment loan seekers may want options that provide flexibility to refinance if interest rates decline.
Asset Selection Criteria
Workforce Housing Focus: Target 1980s-2000s vintage properties in employment-adjacent locations with minimal luxury competition. These assets provide stable cash flows during market adjustment while positioned for rent growth recovery.
Value-Add Positioning: Seek properties with unit mix mismatch, deferred maintenance, or below-market rent rolls. Premium 2-bedroom+ units with strong amenities, views, and modern updates continue to attract qualified renters.
Location Quality: Prioritize proximity to biotech corridors, university campuses, and major employment centers. San Diego's life science sector ($54.1 billion GDP) is increasingly competitive with Boston and San Francisco, with major employers like Pfizer, Illumina, Apple, Microsoft, Amazon, and Qualcomm expanding presence.
Portfolio Strategy Integration
For California-based investors, San Diego represents core portfolio diversification away from Orange County property management concentration. The market's institutional-grade fundamentals provide stability during regional market cycles while offering exposure to different employment and regulatory dynamics.
With median single-family home prices around $1 million, a huge segment of the population is locked into renting, providing built-in tenant base for landlords. This affordability-driven demand creates defensive characteristics that complement growth-oriented markets in other regions.
The combination of supply normalization ahead, stable institutional interest, and diverse economic fundamentals positions San Diego multifamily as a compelling addition to investment portfolios focused on risk-adjusted returns rather than speculative appreciation.
Frequently Asked Questions