The Scale of OC's Supply Surge
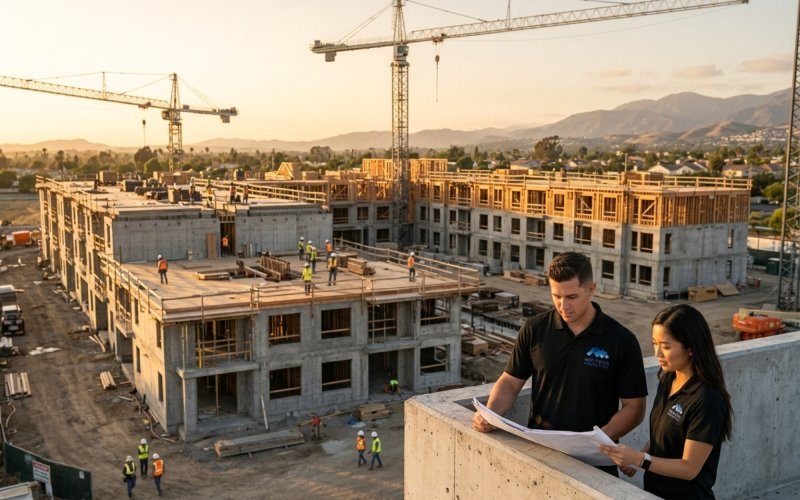
The numbers tell a stark story. After years of development delays caused by supply chain disruptions and labor shortages, Orange County's multifamily pipeline is finally delivering. 1,047 units came online in Q1 2026 across 12 major projects, representing a 340% increase over the previous quarter's deliveries.
We've tracked this surge for months through our development pipeline monitoring. The delayed deliveries created an artificial supply shortage in 2024-2025, pushing vacancy rates below 3% in many submarkets. Now that backlog is hitting all at once, fundamentally shifting market dynamics.
The geographic concentration amplifies the impact. Nearly 60% of new supply is concentrated in just four submarkets: Irvine (312 units), Anaheim (189 units), Costa Mesa (164 units), and Fullerton (147 units). This clustering means certain areas face severe oversupply while others remain relatively insulated.
Q1 2026 deliveries represent the largest quarterly supply increase in over a decade.
| Quarter | Units Delivered |
|---|---|
| Q3 2025 | 308 |
| Q4 2025 | 247 |
| Q1 2026 | 1,047 |
| Q2 2026 (Projected) | 892 |
Submarket-by-Submarket Impact Analysis
Not all Orange County submarkets face equal supply pressure. Our analysis reveals three distinct tiers of impact based on new supply relative to existing inventory and historical absorption rates.
High-Impact Submarkets
Irvine faces the most severe oversupply situation. The 312 units delivered in Q1 represent a 4.2% increase to total rental inventory in a single quarter. Three major projects—Park Place Irvine (124 units), Irvine Gateway (98 units), and Spectrum Residential (90 units)—all target the same high-end renter demographic.
We're already seeing the impact in our managed properties. Vacancy rates in Class A Irvine properties jumped from 2.1% in December 2025 to 5.8% in March 2026. Properties are offering concessions for the first time since 2020, with one month free becoming standard and some offering two months free plus waived deposits.

Anaheim presents a more complex picture. The 189 new units span multiple property classes, from affordable housing near the stadium district to luxury units in Anaheim Hills. The mixed-income supply reduces direct competition between properties but creates downward rent pressure across the spectrum.
Costa Mesa supply concentrated heavily in the South Coast Metro area, directly competing with existing Class A inventory. The Triangle development alone added 89 units within a quarter-mile of three established communities, creating intense local competition.
Moderate-Impact Submarkets
Submarkets like Huntington Beach, Newport Beach, and Mission Viejo face moderate supply increases. New construction ranges from 45-78 units per submarket—meaningful but not overwhelming relative to existing inventory.
These markets benefit from stronger fundamentals and higher barriers to new construction. Coastal properties maintain premium positioning despite increased supply. We've seen vacancy upticks but minimal rent concessions in well-positioned assets.
Low-Impact Submarkets
Inland communities like Yorba Linda, La Habra, and San Juan Capistrano received minimal new supply. Limited developable land and entitlement constraints continue protecting these markets from oversupply.
Vacancy rates in these submarkets actually improved in Q1 2026 as renters priced out of coastal markets sought inland alternatives. This migration pattern creates investment opportunities for value-oriented properties in these areas.
Which Property Classes Face Greatest Risk
The supply surge impacts different property classes unevenly. Understanding these dynamics helps investors identify both risks and opportunities across their portfolios.
Class A properties face the most direct competition from new supply. Approximately 78% of new deliveries target the luxury rental segment, creating an oversupply in this specific niche. New properties offer modern amenities—rooftop pools, co-working spaces, smart home technology—that older Class A assets struggle to match.
We've observed rent rolldowns averaging 8-12% on Class A lease renewals where new competition exists nearby. Properties built before 2015 without recent capital improvements are particularly vulnerable. The amenity gap between older luxury properties and new construction has never been wider.

Class B properties demonstrate surprising resilience. Only 18% of new supply targets the middle-market segment, leaving most Class B inventory insulated from direct competition. These properties benefit from flight-to-quality renters downsizing from expensive Class A units.
In our managed Class B portfolio, we're seeing increased demand from renters earning $75,000-$120,000 annually who previously targeted Class A properties. Occupancy rates remained stable at 96.2% through Q1 2026, with modest rent growth continuing in select properties.
Class C properties face minimal direct competition but experience indirect pressure as rent increases slow market-wide. These assets benefit from continued demand for workforce housing but struggle with rising operating costs and deferred maintenance needs.
Unit Type Competition Patterns
New supply heavily skews toward one-bedroom units, creating acute competition in this segment while leaving others relatively protected.
One-bedroom units dominate new construction, creating oversupply in this segment while family-sized units remain scarce.
| Unit Type | Units Delivered |
|---|---|
| Studio | 89 |
| 1-Bedroom | 542 |
| 2-Bedroom | 324 |
| 3-Bedroom+ | 92 |
One-bedroom units comprise 52% of new supply, far exceeding typical demand ratios. This concentration reflects developers' focus on maximizing unit count and rental yield per square foot. However, the strategy creates oversupply pressures specifically in the 700-900 square foot range.
Existing one-bedroom inventory faces significant rent pressure. We've tracked average asking rents declining 6-9% for one-bedroom units in submarkets with heavy new supply, while two and three-bedroom units maintain pricing power.
Two-bedroom units benefit from more balanced supply-demand dynamics. Family formation trends and remote work preferences continue driving demand for larger units. Properties with spacious two-bedroom layouts (1,000+ square feet) maintain competitive advantages.
Three-bedroom and larger units remain in chronic short supply. Only 92 units (8.8% of new supply) offer three or more bedrooms, despite strong demand from families seeking alternatives to homeownership. This scarcity creates opportunities for investors willing to convert or expand existing units.
Rent Growth and Pricing Pressure Timeline
The supply impact unfolds predictably but unevenly across different property segments. Understanding this timeline helps investors optimize leasing strategies and capital allocation.
Immediate impact (Q1-Q2 2026) focuses on direct competition areas. Properties within a half-mile of major new deliveries experienced immediate vacancy increases and concession pressure. This initial wave affects roughly 25% of Orange County's multifamily inventory.
We've documented rent rolldowns averaging $150-$300 per month in directly impacted properties. Concessions escalated from rare promotional offers to standard practice. The speed of this change caught many property managers unprepared.
Secondary impact (Q3-Q4 2026) spreads market-wide as increased competition forces properties to compete more aggressively. Even properties without direct new supply competition face pressure as renters gain negotiating power.
Rent growth projections for the remainder of 2026 average 1-2% annually, down from 5-7% in 2024-2025. Some submarkets may see flat or negative rent growth as the market absorbs excess inventory.

Recovery phase (2027-2028) depends on absorption rates and new construction starts. If developers delay future projects due to current oversupply, markets could rebalance within 18-24 months. However, continued construction would extend the adjustment period.
Historical patterns suggest coastal submarkets recover faster than inland areas due to land constraints and higher demand fundamentals. Investors should plan for extended soft conditions in heavily supplied inland markets.
Strategic Investment Adjustments for 2026
This supply environment demands fundamental strategy shifts. Approaches that worked during the supply-constrained years of 2020-2025 may prove counterproductive in an oversupplied market.
Acquisition Strategy Refinements
Value-add opportunities become more attractive as distressed sellers emerge. Properties facing severe competition from new supply may trade at discounts, creating opportunities for buyers who can weather short-term vacancy increases.
We're targeting properties with genuine competitive advantages—superior locations, unique unit mixes, or below-market rents that justify renovation investments. The key is identifying assets that can differentiate themselves from generic new construction through targeted improvements.
Underwriting must account for extended lease-up periods and higher vacancy assumptions. Our 2026 models use 7-9% vacancy assumptions versus 4-5% in previous years. This conservative approach protects against overpaying in uncertain conditions.
Development deals require extreme caution. Ground-up construction starting in 2026 will deliver into potentially oversupplied markets in 2028-2029. Only projects with exceptional locations, unique product types, or favorable basis should proceed.
Portfolio Management Priorities
Capital improvement timing becomes critical. Properties facing immediate new supply competition need defensive upgrades—unit renovations, amenity improvements, exterior enhancements—to compete effectively.
However, major capital projects in oversupplied markets may not generate expected returns. We're prioritizing maintenance and cosmetic improvements that enhance competitiveness without requiring significant rent increases to justify costs.
Operational efficiency gains increased importance as revenue growth slows. Properties must reduce operating costs while maintaining service levels. This includes energy efficiency upgrades, maintenance optimization, and staffing adjustments.
Technology investments in property management systems, resident communication platforms, and maintenance tracking provide competitive advantages. These improvements reduce costs while enhancing resident satisfaction and retention.
Identifying Opportunities Within the Oversupply
While oversupply creates challenges, it also generates investment opportunities for prepared investors with available capital and risk tolerance.
Distressed acquisition opportunities are emerging as leveraged owners face cash flow pressure. Properties purchased with aggressive assumptions in 2024-2025 may require capital infusions or face refinancing challenges.
We're seeing preliminary discussions with owners of Class A properties experiencing 15%+ vacancy increases. These conversations could develop into acquisition opportunities by Q3-Q4 2026 if conditions don't improve.
The key is patient capital deployment. Distressed acquisitions require 2-3 year hold periods to execute repositioning strategies and benefit from market recovery. Investors seeking quick returns should avoid this strategy.
Market share consolidation opportunities exist for experienced operators. Smaller property management companies struggle with increased leasing costs and resident turnover, creating openings for established firms to acquire management contracts.
Our management division is actively pursuing these opportunities. Properties benefit from our economies of scale, marketing reach, and operational systems. Owners benefit from improved performance during challenging market conditions.
Alternative product repositioning becomes viable as traditional multifamily faces oversupply. Converting office buildings, retail spaces, or underutilized land to residential use encounters less competition from conventional development.
Long-Term Market Implications
This supply surge represents more than a temporary adjustment—it signals structural changes in Orange County's multifamily market that will influence investment decisions for years.
Development economics have shifted permanently. Construction costs increased 35-40% since 2020 while achievable rents face downward pressure from oversupply. This gap reduces development feasibility and should slow future construction starts.
Land values in secondary markets may decline as development prospects diminish. Conversely, prime locations with development constraints may see relative value increases as scarcity becomes more apparent.
Tenant preferences evolved during the supply-constrained years and continue adapting to increased choice. Remote work capabilities, flexible lease terms, and comprehensive amenity packages are becoming standard expectations rather than differentiators.
Properties that invested early in these features maintain competitive advantages. Those that delayed improvements face expensive catch-up requirements in a revenue-challenged environment.
Institutional investment patterns are shifting toward more defensive strategies. Large investors are rotating from aggressive growth markets to stable, cash-flowing properties in supply-constrained submarkets.
This rotation creates opportunities for smaller investors willing to accept higher risk in oversupplied areas while potentially facing increased competition for stable assets in protected markets.
The current supply surge will ultimately create a healthier, more balanced market. However, the adjustment period requires careful navigation and strategic patience. Investors who adapt quickly to new conditions while maintaining long-term perspective will emerge strongest when markets rebalance.
Frequently Asked Questions