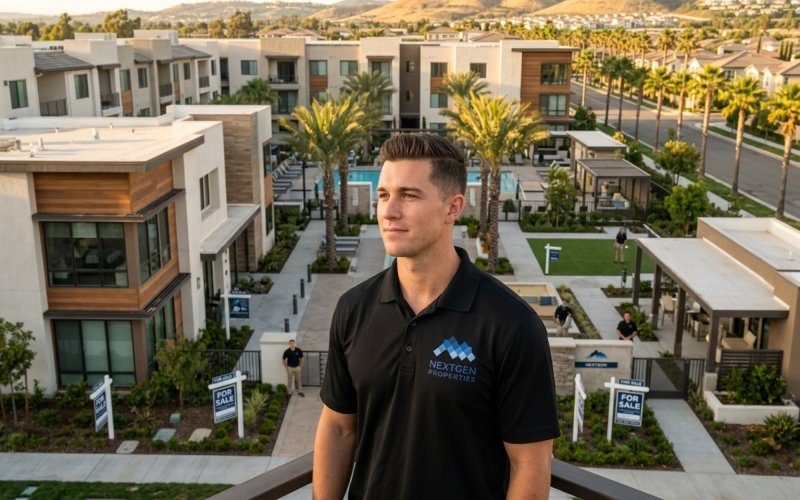
Orange County isn’t one market — it’s a collection of distinct submarkets with meaningfully different risk profiles, cap rates, vacancy levels, and tenant demographics. Coastal OC delivers premium rents and strong appreciation but compresses cap rates and often produces negative cash flow at today’s financing costs. Inland OC offers stronger initial yields, real value-add opportunity, and more manageable entry points. Here’s the full 2026 comparison.
One of the most common mistakes OC multifamily investors make is treating “Orange County” as a single market. It isn’t. The cap rate, vacancy, renter demographics, appreciation history, and value-add opportunity in Newport Beach look almost nothing like what you find in Anaheim — even though both are in the same county, 15 miles apart. Understanding the submarket dynamics is essential for building a coherent investment thesis.
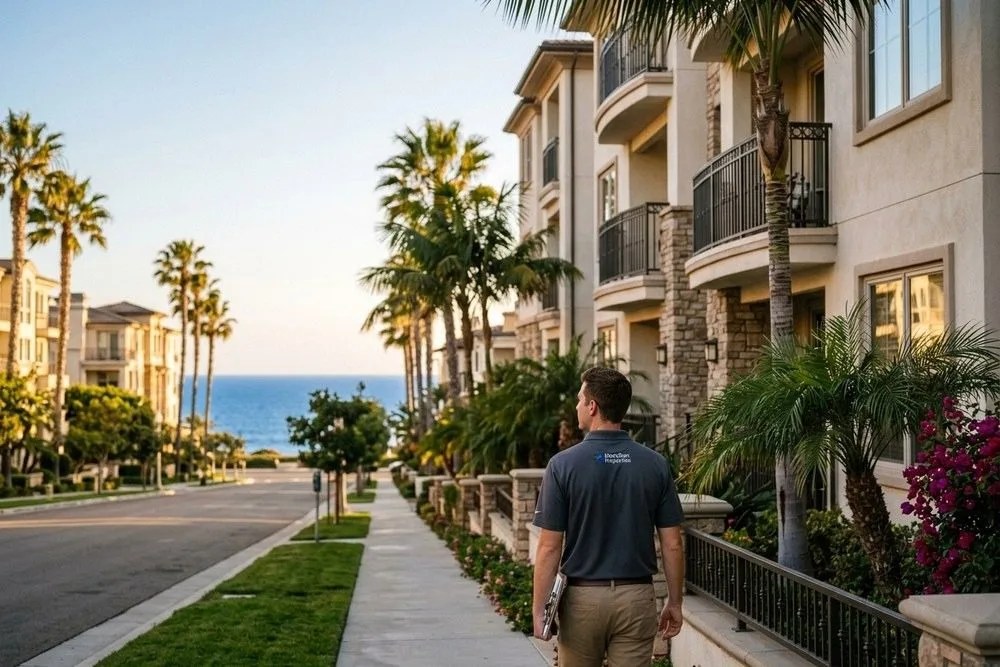
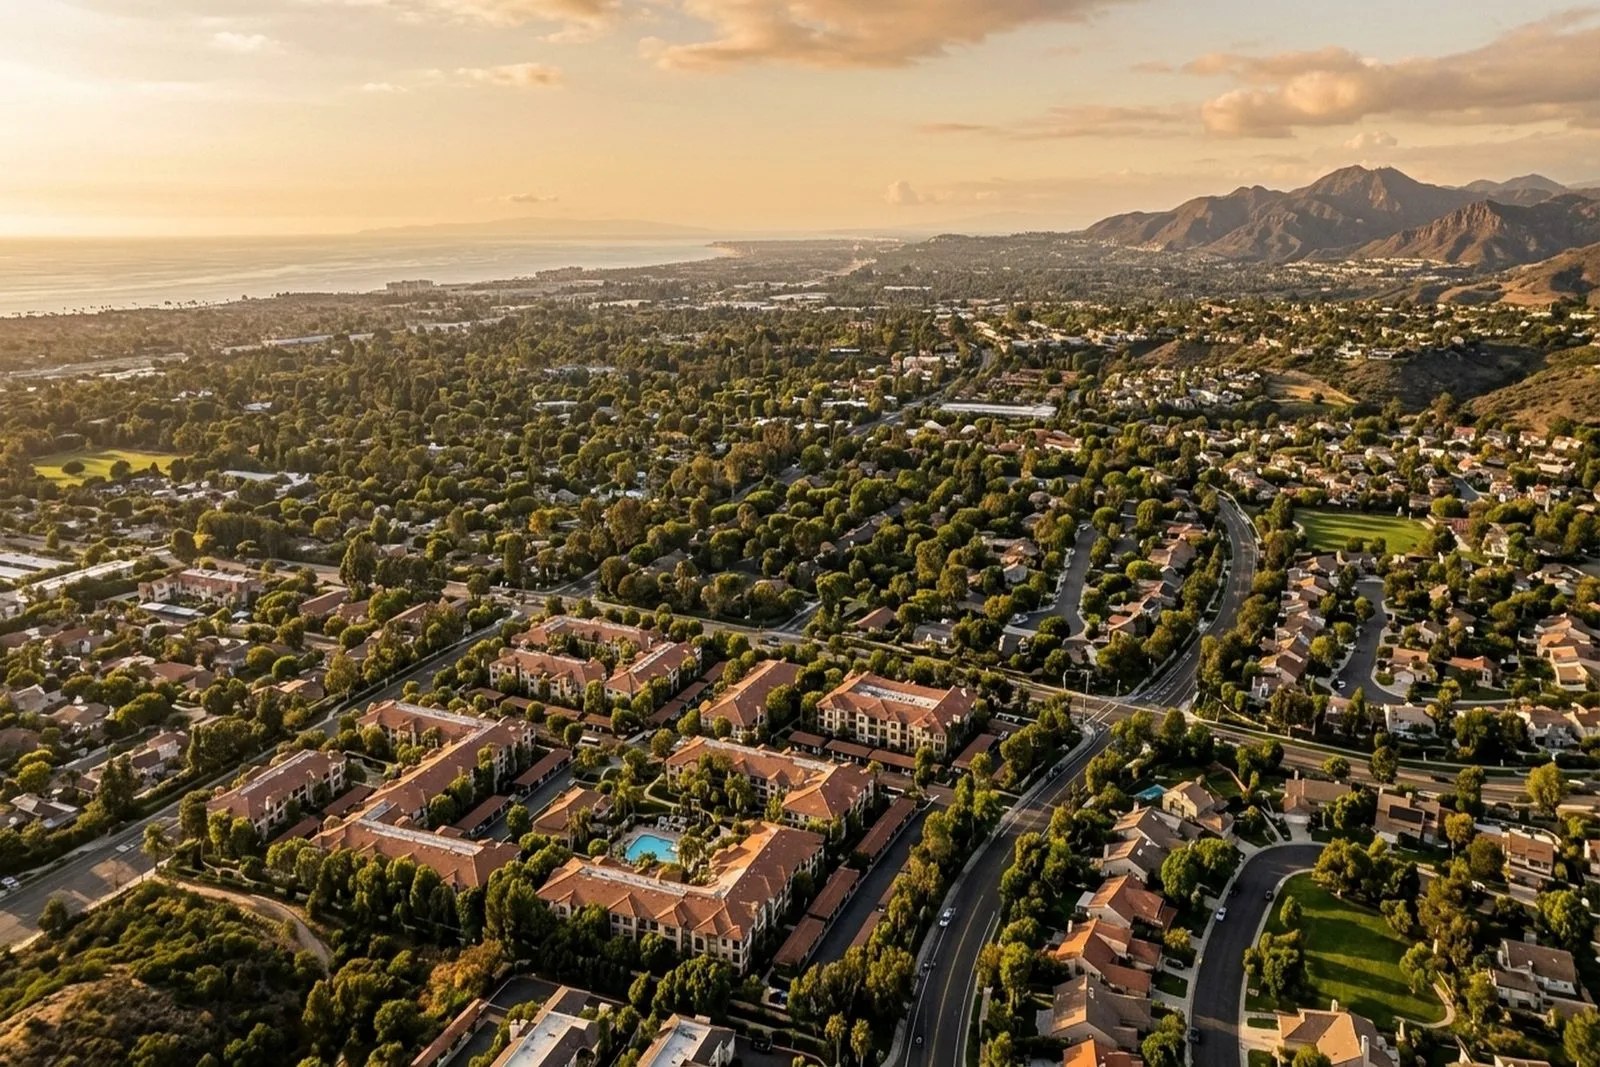
Coastal OC: Newport Beach, Costa Mesa, Huntington Beach, Laguna Beach
What defines these markets: Direct proximity to the Pacific, high barriers to new supply (established neighborhoods, Coastal Commission restrictions, limited infill), and a high-income renter base including young professionals in Newport/Irvine corridor firms, healthcare workers at Hoag Hospital, and tech employees at companies headquartered in Newport Beach and Costa Mesa.
Vacancy: 2.5–3.5% — among the tightest in Southern California. Class B and C product in Costa Mesa and Huntington Beach effectively has no vacancy. Units come available and lease within 10–21 days in a well-managed portfolio.
Coastal submarkets command significant rent premiums across all unit types. Studios start near $2,150/mo and 3-bedrooms exceed $5,500/mo at the top of the range.
| Unit Type | Range | Midpoint |
|---|---|---|
| Studio | $1,900–$2,400 | $2,150 |
| 1 Bedroom | $2,400–$3,200 | $2,800 |
| 2 Bedroom | $3,200–$4,500 | $3,850 |
| 3 Bedroom | $4,500–$6,500+ | $5,500 |
Cap rates: 3.5–4.2% for Class B product; sub-3.5% for well-located Class A.
Value-add opportunity: Limited for large rent gap plays (rents are mostly at market), but meaningful for ancillary income programs (WiFi, RUBS, storage) and cosmetic renovations at turnover.
Who buys here: Long-term appreciation investors, 1031 exchange buyers, and investors with enough equity to absorb negative leverage in the near term.
Mid-County OC: Irvine, Santa Ana, Fountain Valley
Irvine has more institutional multifamily investment than anywhere else in OC. REITs own large communities here and the renter base — UCI students, tech and biotech professionals, international families — supports strong rent growth. However, Irvine also has more new supply than any other OC submarket. 2025 saw the most new completions countywide here, and near-term rent growth is more muted as a result.
Santa Ana is the value-add submarket that surprises investors who discover it late. Rents are below coastal OC, creating meaningful upside for operators who can improve management and unit condition. Workforce housing demand is extremely durable — the renter base includes essential workers and service industry employees who have virtually no homeownership alternative. Vacancy in workforce product is effectively 2–3%.
Cap rates in mid-county: 4.2–5.0% depending on submarket and asset quality.
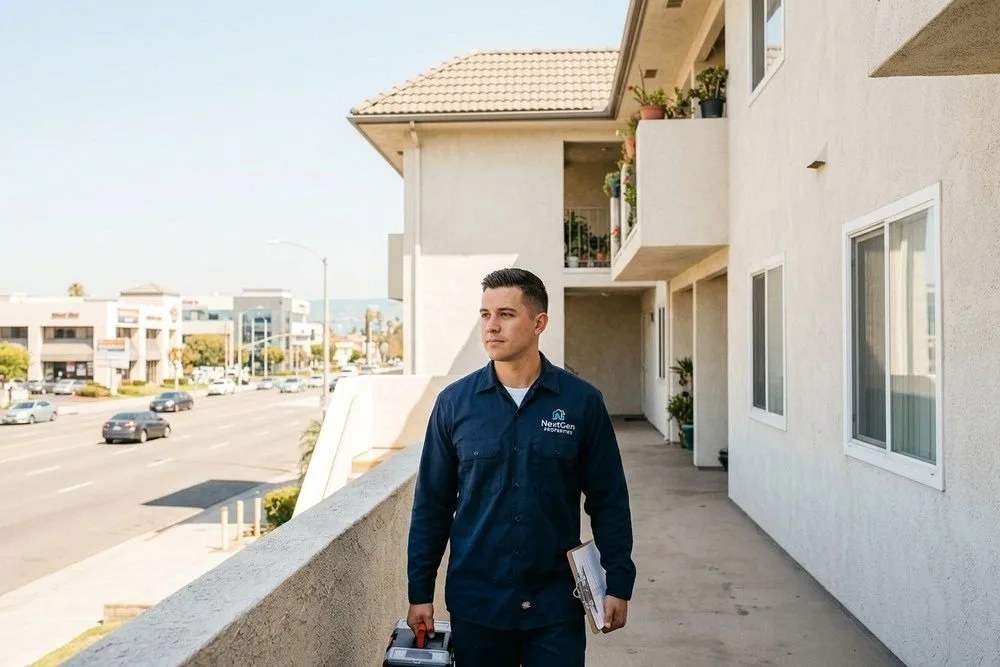
Inland OC: Anaheim, Fullerton, Garden Grove, Buena Park
Anaheim is arguably the most interesting value-add submarket in OC right now. The Disneyland area employs 36,000 people and the DisneylandForward expansion — a $1.9 billion, 40-year development plan approved in 2024 — adds sustained employment demand to the immediate area. Anaheim rents have grown faster than any other OC submarket in the past 12 months and the supply pipeline here is thin.
Fullerton and Garden Grove offer workforce housing at Class B prices with cap rates that still allow positive leverage at today’s financing costs. Value-add plays are genuinely achievable through unit renovation and operational improvement — not just NOI optimization on stabilized assets.
Cap rates in inland OC: 4.8–6.0% — the only OC submarkets where debt financing at 6.5% doesn’t automatically produce negative leverage. See our full analysis on negative leverage in OC real estate.
Coastal OC trades at 3.8–3.9% caps with sub-2.5% vacancy. Inland OC offers 5.0–5.4% caps at 4.3–4.5% vacancy. The spread quantifies exactly what the coastal quality premium costs.
Side-by-Side Comparison: Coastal vs. Inland OC
| Factor | Coastal OC | Inland OC |
|---|---|---|
| Cap rate range | 3.5–4.2% | 4.8–6.0% |
| Average vacancy | 2.5–3.5% | 3.5–5.0% |
| 1BR average rent | $2,400–$3,200 | $1,600–$2,200 |
| Cash flow at 70% LTV, 6.5% rate | Typically negative | Neutral to modestly positive |
| 5-year appreciation history | Strong (30–50%+) | Moderate (15–25%) |
| Value-add rent gap | Small (rents at market) | Moderate to significant |
| Typical investor profile | Appreciation play, long hold | Value-add, cash flow, yield-focused |
Which Submarket Is Right for Your Strategy?
Choose coastal OC if: You have significant equity (40%+ down or all-cash), your primary objective is long-term appreciation, you have a 7–10 year minimum hold horizon, and you can absorb negative cash flow in early years.
Choose inland OC if: You need cash flow neutrality from the acquisition, you want to execute a genuine value-add program, or you’re a new OC investor who wants a more forgiving entry point where the numbers work at standard LTV ratios.
Most sophisticated OC investors hold assets in both categories — using inland OC for cash flow stability and coastal OC for appreciation upside. For a deeper look at underwriting in any of these submarkets, see our full guide on how to underwrite OC multifamily.
Frequently Asked Questions