Tampa's multifamily market presents a compelling cap rate arbitrage opportunity as we head into 2026. Current yields of 6.2% to 7.1% across quality properties reflect temporary institutional capital flight, creating entry points that won't persist once fundamentals realign. Our analysis shows Tampa's job growth, population influx, and constrained supply pipeline setting up for cap rate compression through late 2026. For California investors facing sub-4% OC yields, Tampa's 300-400 basis point premium offers meaningful cash flow diversification. The window for optimal entry pricing narrows as institutional buyers return to secondary Sun Belt markets.
Tampa Cap Rate Landscape 2026
Every Tampa submarket delivers 200+ basis points above OC rates — even transitional areas like Seminole Heights at 7.1% nearly double Orange County's 4.0% average
Tampa's multifamily cap rates have stabilized in the 6.2% to 7.1% range through early 2026, representing a significant premium over California coastal markets. This 90-basis-point spread within Tampa reflects property quality, submarket dynamics, and deal structure variations that create distinct investment tiers.
Class A properties in downtown Tampa and Westshore command the lowest cap rates at 6.2% to 6.5%, driven by institutional-grade construction and proximity to major employment centers. Class B workforce housing in submarkets like Carrollwood and Temple Terrace trades at 6.7% to 6.9%, while value-add opportunities in transitional areas like Seminole Heights reach 7.1%.
The premium to California markets remains substantial. While OC multifamily submarket ROI analysis shows Newport Beach and Irvine properties trading at 3.8% to 4.2% cap rates, Tampa's 200+ basis point advantage translates to meaningful cash flow differences on equivalent investment sizes.
Institutional Capital Flight and Return Timing
Tampa's current cap rate levels reflect temporary institutional capital absence rather than fundamental market weakness. Major pension funds and REITs reduced secondary market allocations through 2025, creating the pricing gap California investors can exploit.
Our conversations with institutional capital sources indicate renewed Sun Belt interest beginning Q3 2026. Blackstone's recent $400 million Florida multifamily acquisition announcement signals broader institutional re-entry, which historically compresses cap rates by 40-60 basis points within 12-18 months.
The timing advantage favors investors who can close transactions in Q2 and Q3 2026. Once institutional bidding resumes at scale, Tampa's cap rate compression will likely follow the Phoenix and Austin patterns we observed in 2023, where rates dropped 70-90 basis points over 15 months.
Employment Growth Fueling Demand
Tampa Bay's job creation continues outpacing national averages, with 1.0% employment growth in 2025 versus 1.8% nationally. The diversified economy spanning finance, healthcare, technology, and logistics creates sustainable rental demand across income segments.
Financial services expansion drives high-income renter growth. Raymond James' headquarters expansion will add 2,800 jobs by late 2026, while JPMorgan Chase's new Tampa operations center brings 3,500 positions. These roles typically generate $65,000-$95,000 salaries, supporting Class A and B+ rental rates.
Healthcare sector expansion reinforces demand stability. Tampa General Hospital's $550 million expansion and AdventHealth's new facilities will employ 4,200 additional healthcare workers by 2027. Healthcare employment provides recession-resistant rental demand supporting long-term NOI stability.
Limited New Supply Pipeline
Tampa's constrained development pipeline creates a supply-demand imbalance favoring existing property owners. New multifamily deliveries will total approximately 8,400 units in 2026, down 18% from 2025 levels and well below the 12,000-14,000 units needed to match household formation.
Development financing constraints limit new starts. Construction costs averaging $185-$210 per square foot require rent levels of $2.10-$2.30 per square foot to achieve developer returns, pricing new Class A units above many renter budgets. This ceiling effect protects existing inventory from oversupply pressure.

Land availability in core submarkets further constrains supply. Developable sites within 15 minutes of downtown Tampa or major employment centers command $8-$12 per square foot, pushing all-in development costs above feasibility thresholds for workforce housing. This dynamic particularly benefits existing Class B properties in established neighborhoods.
Key Submarket Investment Analysis
Downtown Tampa Core
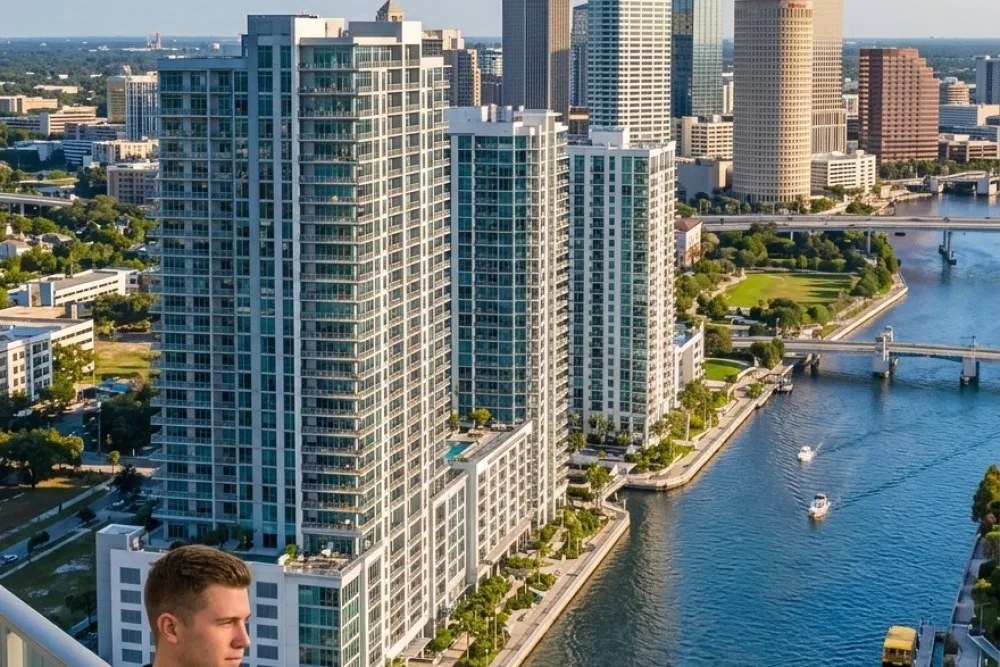
Downtown Tampa offers the lowest cap rates but highest appreciation potential. Current 6.2% to 6.4% yields on quality properties reflect proximity to major employers, walkable amenities, and limited development sites. The submarket absorbed 890 net units in 2025 despite delivering 1,200 new units, demonstrating robust demand.
Investment thesis centers on continued employment concentration and lifestyle preferences. Companies like Foundever (formerly Sykes), TD Synnex (formerly Tech Data), and growing fintech operations draw young professionals who value urban walkability. Average rent growth of 4.8% in 2025 exceeded suburban submarkets, supporting NOI expansion even at compressed cap rates.
Westshore Business District
Westshore presents the optimal balance of yield and growth potential for California investors. Cap rates of 6.4% to 6.7% reflect institutional-quality properties with strong employment proximity but without downtown Tampa's premium pricing. The submarket houses Tampa International Airport, major hotels, and Fortune 500 regional headquarters.
Development pipeline analysis shows minimal new supply through 2027. Only 450 units under construction compared to annual absorption of 680-750 units. This supply constraint supports rent growth projections of 3.5% to 4.2% annually, creating NOI expansion opportunities for current buyers.
Carrollwood and Temple Terrace
These established northern suburbs offer value-oriented cash flow at 6.7% to 6.9% cap rates. Properties target families and working professionals seeking affordable alternatives to downtown pricing. Average rents of $1,450-$1,650 for two-bedroom units maintain accessibility while generating solid returns.
The investment appeal lies in demographic stability and moderate rent growth potential. These areas house teachers, healthcare workers, and service professionals with steady employment. Rent growth tracks inflation plus 1-2%, providing predictable NOI increases without gentrification concerns that complicate value-add strategies.
California Investor Positioning
California investors possess distinct advantages in Tampa's current market cycle. Equity extraction from OC properties at 3.8-4.2% cap rates enables 1031 exchanges into Tampa assets yielding 6.2-7.1%, immediately improving cash flow while maintaining tax deferral benefits.
Our portfolio analysis shows a typical $2 million Orange County fourplex generating $6,000-$7,000 monthly NOI can exchange into a Tampa 20-unit property producing $11,000-$13,000 monthly. The cash flow increase of 65-85% compensates for geographic diversification and provides inflation protection through rent growth.
Management infrastructure in Tampa supports out-of-state ownership. Established property management companies with institutional experience charge 4-6% fees, comparable to California rates. Technology platforms enable remote oversight while local teams handle day-to-day operations, leasing, and maintenance.

Tax considerations favor Florida investment for California residents. No state income tax on rental income provides immediate cash flow improvement, while property tax rates of 0.8-1.1% compare favorably to California's 1.2-1.8% effective rates on investment properties. Combined tax savings can improve net returns by 40-60 basis points annually.
Financing Market Opportunities
Tampa multifamily financing markets offer competitive terms that enhance investment returns. Agency lending through Fannie Mae and Freddie Mac provides 75-80% LTV at rates 80-120 basis points below California hard money or portfolio lenders. Ten-year fixed-rate loans at 5.8-6.2% lock in favorable long-term cost of capital.
Regional and community banks actively compete for quality Tampa multifamily deals. First Citrus Bank, CenterState, and Synovus offer portfolio lending with faster closings and more flexible underwriting than national lenders. These relationships become valuable for repeat investors building Tampa portfolios.
DSCR requirements remain reasonable at 1.20-1.25x for stabilized properties, compared to 1.35-1.40x common in California markets. Lower debt service coverage ratios enable higher leverage while maintaining conservative underwriting standards. Bridge financing for value-add deals prices at 7.5-8.5%, competitive with national markets.
Risk Factors and Market Considerations
Hurricane exposure represents Tampa's primary investment risk, though modern construction standards and insurance markets provide adequate protection. Properties built after 2005 incorporate enhanced wind resistance, while flood zones affect limited areas outside core investment submarkets.
Insurance costs average $2,200-$2,800 annually per unit for windstorm and flood coverage, factored into our cap rate analysis. Recent rate stabilization following 2022-2023 increases provides predictable expense planning. Many institutional-quality properties include hurricane-resistant features that reduce premiums.
Population growth sustainability depends on continued job creation and housing affordability. Tampa's cost of living remains 15-20% below comparable California markets, supporting in-migration trends. However, rapid rent increases could eventually limit workforce attraction and economic growth, requiring careful submarket selection focused on employment proximity.
Optimal Investment Timing and Strategy
The investment window for attractive Tampa cap rates narrows through 2026 as institutional capital returns. Q2 and Q3 2026 present optimal entry timing before widespread institutional competition compresses yields. Early positioning enables investors to benefit from both cash flow and capital appreciation as markets normalize.
Portfolio construction should emphasize stabilized Class B properties in employment-proximate locations. These assets provide immediate cash flow while offering moderate value-add potential through unit improvements and operational efficiency. Properties requiring significant capital investment face construction cost inflation and permitting delays that can impair returns.
California investors should target $3-8 million acquisitions that justify professional management while maintaining hands-on oversight capability. Properties in the 20-60 unit range offer operational efficiency without requiring institutional-scale resources. Multiple smaller acquisitions across different submarkets provide geographic diversification within the Tampa market.
For investors considering multifamily investment tax strategy comparisons, Tampa's no-state-income-tax advantage over California creates compelling after-tax returns. The cash flow differential combined with tax savings often justifies geographic diversification despite increased management complexity.
Frequently Asked Questions